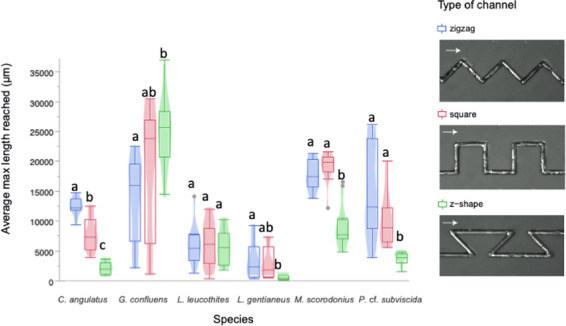
Fig. 4. Distances reached by the fungal species within the differently angled channels (Fig. 2b).

Box plots show the mean final distances reached by the hyphae in channels of the same type (n = 11). Different letters indicate a significant difference of colonisation distances for each species according to ANOVA followed by Tukey-Kramer’s HSD test at p < 0.05 (Table S3). The legend contains examples of the differently angled channels colonised by P. cf. subviscida, where arrows indicate growth directions.
