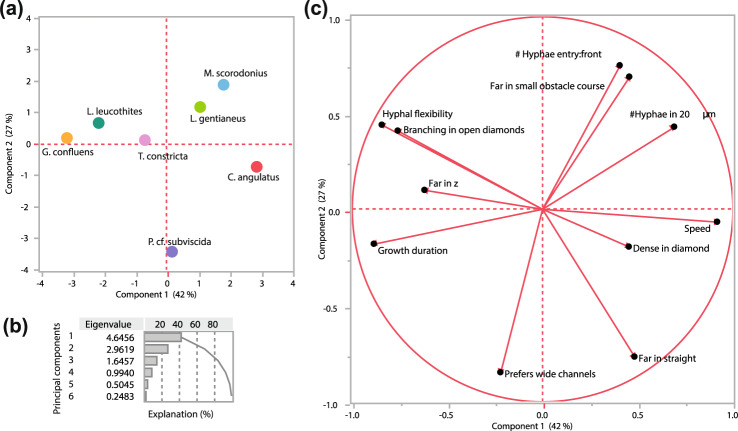
Fig. 7. Principal component analysis (PCA) of the measured traits for the seven fungal species investigated (Table S2).
a Score plot for the seven species along two dimensions of PC1 and PC2. b Explanation of the variation. Cumulatively explained variation of PC1 and PC2 is 69.4%. c Loading plot of the variables included in the PC analysis. Dashed lines connect the different locations of the loading variables for distance growth in different spatial structures. Details on the measurements can be found in Table S2.

