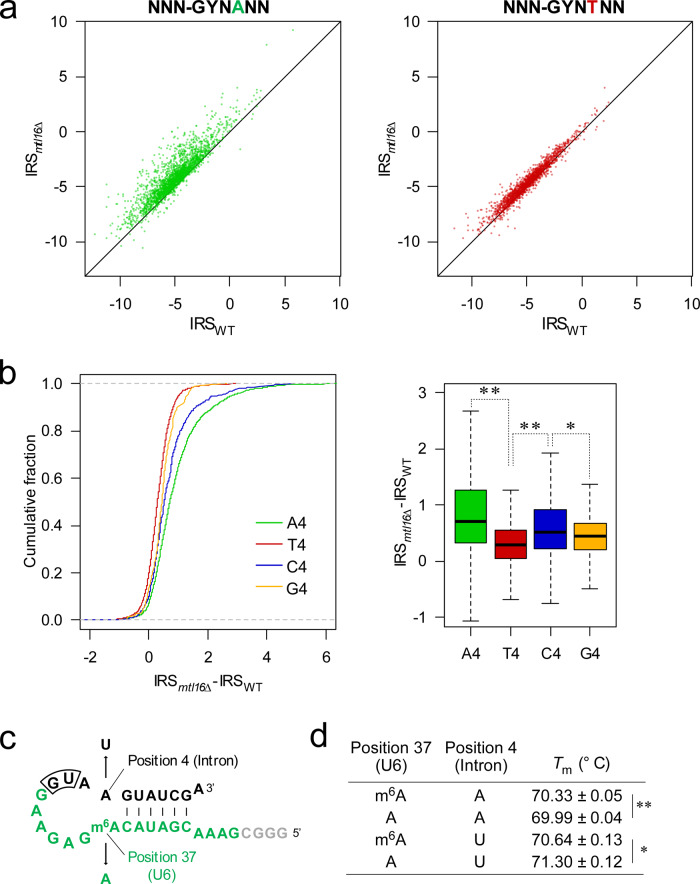
Fig. 3. The fourth nucleotide of the intron is the cis-element for sensitivity against m6A loss.
a Scatter-plots of IRS of A4 and T4 introns in mtl16Δ versus WT. The black lines represent an equal value of IRS. b The left panel shows a cumulative plot of IRS differences for each group of classified introns in mtl16Δ versus WT. All introns are classified into four groups based on their fourth nucleotide. The right panel shows a box plot of IRS differences for each group of introns. The first quartile, median, and third quartile are shown, and the whiskers represent 1.5 × interquartile ranges. Sample numbers are n = 2539, n = 1846, n = 514, and n = 157 for A4, T4, C4, and G4, respectively. *p = 6.6 × 10⁻³ and **p < 2.2e-16 (two-sided Wilcoxon’s rank-sum test). c Primary and secondary structure of the model RNA substrate and its mutation and modification introduced to the position 4 of intron and position 37 of U6 snRNA, respectively, used for measuring melting temperatures (Tm). Black and green characters represent the sequence derived from intron and U6 snRNA, respectively. The first dinucleotide at the 5′SS in the intron is boxed. d Tm values of the model RNA substrates. Asterisks indicate statistically significant differences, as determined by two-sided Student’s t-test. **p = 7.6 × 10⁻⁴, *p = 3.0 × 10⁻³; n = 3 independent experiments. Source data are provided as a Source Data file.

