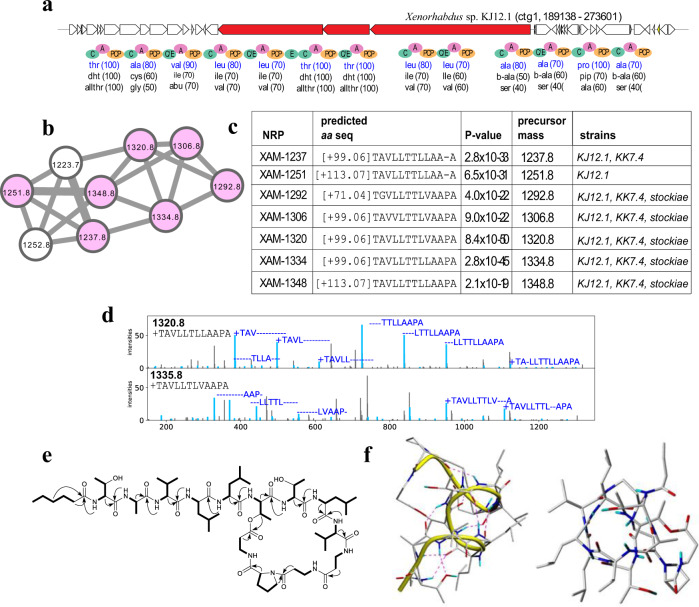
Fig. 5. Identifying xenoamicin-like (XAM) NRP family.
a The BGCs generating the NRP in Xenorhabdus sp. KJ12 along with NRPS genes (shown in red) and A-, C-, PCP-, and E-domains in these NRPSs. The rest of the genes in the corresponding contigs are shown in white. Three highest-scoring amino acids for each A-domain in these BGCs (according to NRPSpredictor2 (ref. 15) predictions) are shown below the corresponding A-domains. Amino acids appearing in the NRP [+99.06]TAVLLTTLLAAPA identified by NRPminer (with the lowest p value) are shown in blue. b Spectral network formed by the spectra that originate from NRPs in the XAM family. c Sequences of the identified NRPs in this family (with the lowest p value among all spectra originating from the same NRP). The p values are computed based on MCMC approach using MS-DPR89 with 10,000 simulations. d For each strain, an annotated spectrum representing the lowest p value is shown. The spectra were annotated based on predicted NRPs [+99.06]TAVLLTTLLAAPA and [+99.06] TAVLLTTLVAAPA from top to bottom. The “+” sign represents the addition of [+99.06]. Supplementary Figures 23 and S24 show the annotated spectra for the other NRPs shown in part (c). e NMR-based correlations of XAM-1320 (m/z 1320.8 [M+H]+) produced by Xenorhabdus KJ12.1 (Supplementary Table 5 and Supplementary Figs. 25–29). HSQC-TOCSY (bold lines) and key ROESY correlations (arrows) are shown. f 3D structure of XAM-1320 derived from 121 ROE-derived distance constraints (Supplementary Table 6), molecular dynamics, and energy minimization. Peptide backbone is visualized with a yellow bar (left). Predicted hydrogen bonds stabilizing the β-helix are shown as dashed lines. View from above at the pore formed by XAM-1320 (right). NRPminer identified this NRP with p value 8.4 × 10−50.

