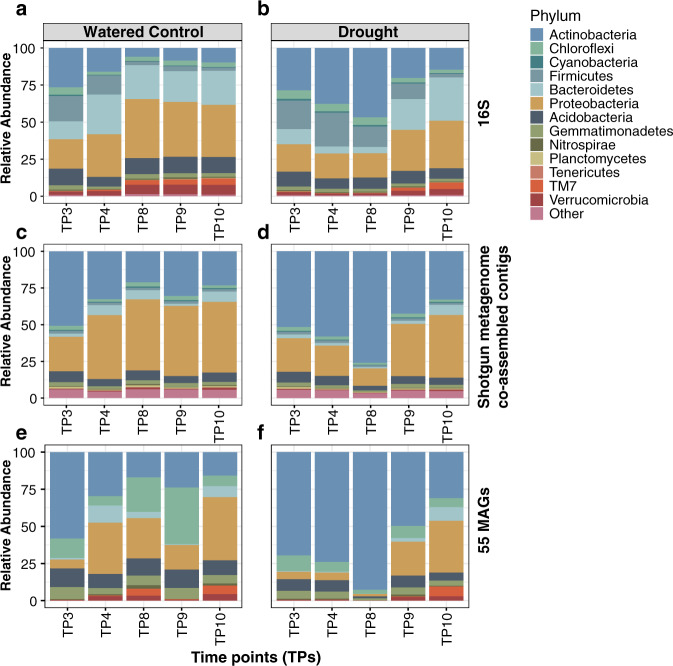
Fig. 1. Relative abundance profiles of microbial taxa in the sorghum rhizosphere under drought.
Percent relative abundance (y-axis) in the rhizosphere of the top 13 most abundant phyla for watered controls (a, c, e) and drought treatments (b, d, f) as measured by 16S rRNA gene amplicon sequencing (a, b), co-assembled contigs from shotgun metagenomic datasets (c, d), and all reads mapping to the 55 metagenome-assembled genomes (MAGs) (e, f). All five time points (TP3−TP10, shown on the x-axis) were selected based on the availability of data across all three data analysis types. All reads that mapped to other phyla or which were not classifiable at the phylum level are grouped into a fourteenth category, entitled Other. TP: time points.

