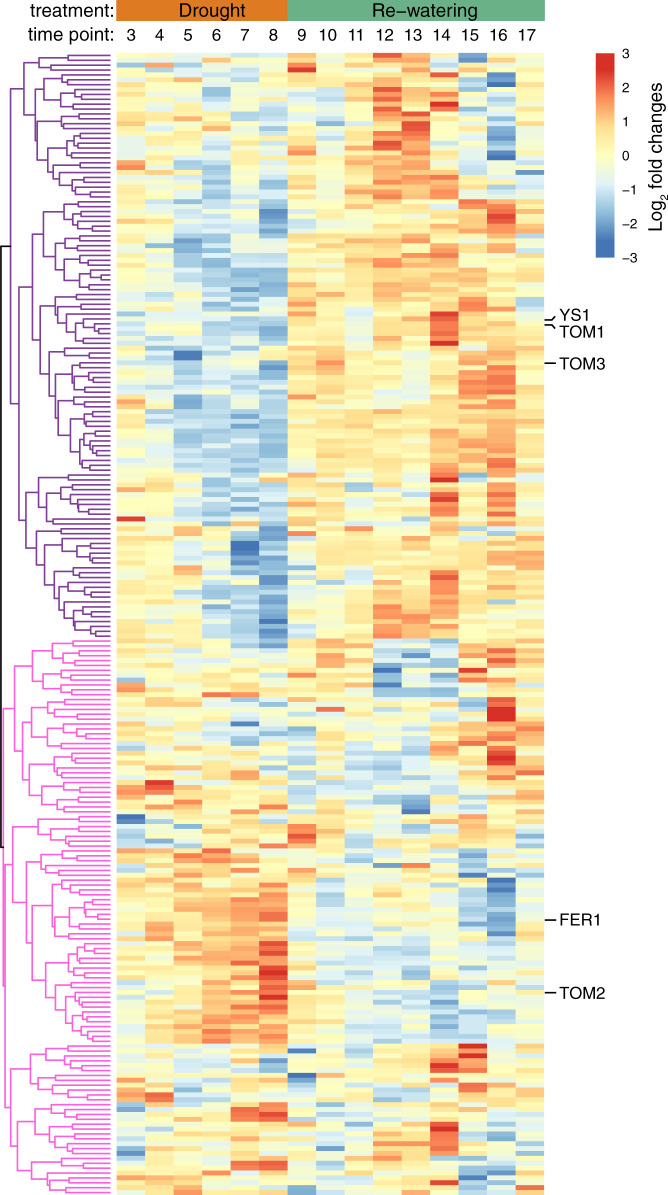
Fig. 5. Iron metabolism gene expression in sorghum roots under drought stress.
Log2 fold expression changes across time (x-axis) in drought-stressed root tissue for the approximately 234 expressed genes annotated as related to iron homeostasis (see Supplementary Data 3). Time points are indicated across the x-axis at the top, and drought (orange) and recovery (green) treatment stages are indicated above the time points. Hierarchical clustering analysis demonstrates two broad patterns of gene expression: a set of genes exhibiting strong downregulation under drought stress (indicated with purple tree branches), and a set of genes exhibiting strong upregulation under drought stress (indicated with pink tree branches). The five labeled genes on the right represent the genes investigated using qRT-PCR in the maize wild-type and tom1 mutant in the next section.

