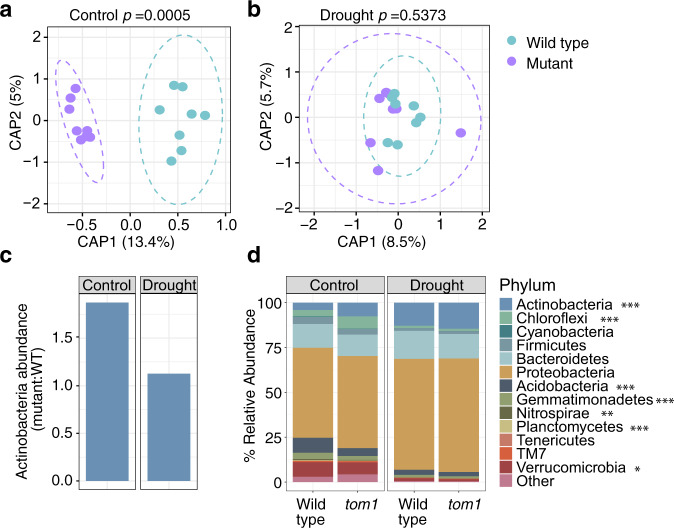
Fig. 6. TOM1 deficiency in plants shapes the composition of the rhizosphere microbial community.
Constrained ordination of rhizosphere microbiome composition showing the effect of plant genotype (wild-type or tom1 mutant) under control (a) and drought (b) conditions. Ellipses show the parametric smallest area around the mean that contains 95% of the probability mass for each genotype. The p-value at the top of each plot represents the significance of the difference between WT and mutant, as evaluated by one-sided PERMANOVA. c The ratio of the relative abundance for Actinobacteria in tom1 vs. wild-type maize under control (left bar) and drought (right bar) conditions. d Relative abundance for the 13 most abundant bacterial phyla in the rhizosphere in both wild-type and tom1 mutant plants grown in the growth chamber for either 2.5 weeks of control (left facet) or drought (right facet) conditions. Significant differences in abundance between WT and the tom1 mutant under control conditions were determined by paired two-sided T-test, and are indicated with asterisks to the right of the phylum name: *, p < 0.05; **, p < 0.01; ***, p < 0.001.

