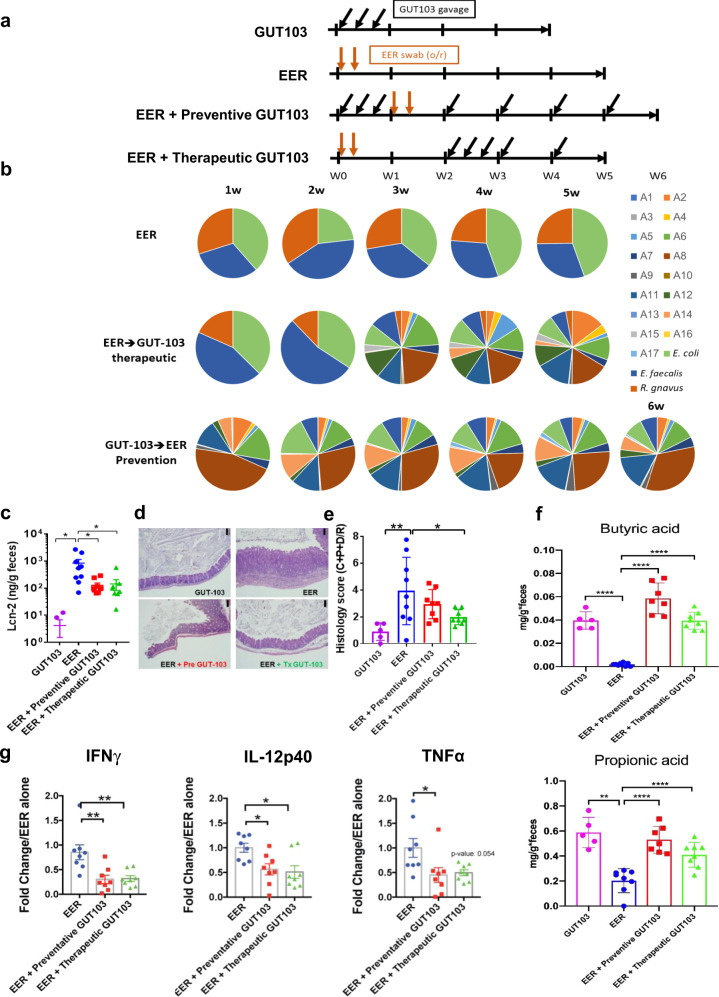
Fig. 1. Effect of gavage with GUT-103 on the gut microbiome community composition, lipocalin-2 levels, histology of the gut epithelium, SCFA synthesis and tissue cytokine expression of Il10−/− mice where experimental colitis was induced by inoculation with Escherichia coli LF82 (E), Enterococcus faecalis OG1RF (E) and Ruminococcus gnavus ATCC29149 (R).
a Schematic overview of experimental design. Gnotobiotic Il10−/− mice were inoculated with GUT-103 (N = 5), EER (N = 9), GUT-103 plus EER (preventive protocol) (N-7), and EER plus GUT-103 (therapeutic protocol) (N = 7). After 5 or 6 weeks, animals were killed and tissue samples were collected for analysis; b Composition of the microbiome in fecal pellets of gnotobiotic 129 Il10−/− mice inoculated with EER, GUT-103 plus EER (preventive protocol), and EER plus GUT-103 (therapeutic protocol) determined by qPCR. Il10−/− mice were inoculated via gavage with GUT-103 (2 × 10+7 cfu/strain) or EER (2 × 10+7 cfu/strain). The composition of the gut microbiome was determined on fecal pellets or after sacrifice on cecal contents using qPCR with species-specific primers. The average community composition (pie diagrams) for seven animals per treatment are presented. Strain legend: A1: Megamonas hypermegale DSM1672; A2 Bacteroides stercoris DSM19555; A3: Anaerostipes hadrus DSM3319; A4: Clostridium symbiosum ATCC14940; A5: Clostridium boltea ATCC BAA-613; A6: Blautia producta DSM2950; A7: Clostridium scindens ATCC35704; A8: Akkermansia muciniphila ATCC BAA-835; A9: Megamonas funiformis DSM19343; A10: Acidaminococcus intestini DSM21505; A11: Bacteroides massiliensis DSM17679; A12: Barnesiella intestinihominis DSM21032; A13: Faecalibacterium prausnitzii DSM17677; A14: Subdoligranulum variabile DSM15176; A15: Anaerostipes caccae DSM14662; A16: Blautia hydrogenotrophica DSM10507; A17: Marvinbryantia formatexigens DSM14469. c Cecal content lipocalin-2 levels at time of sacrifice from GUT-103 group (N = 5), EER group (N = 9), GUT-103 plus EER group (N = 9), and EER plus GUT-103 group (N = 8), Mann–Whitney unpaired two-tailed t-test. Mean ± SE, *P < 0.05. d Representative histology pictures of H&E-stained cecum tissue (×100). The bar (upper right corner) in the pictures indicates 100 µm from GUT-103 group (experiment was repeated five times independently with similar results), EER group (experiment was repeated nine times independently with similar results), GUT-103 plus EER group (experiment was repeated eight times independently with similar results), and EER plus GUT-103 group (experiment was repeated eight times independently with similar results). e Histology scores of GUT-103 group (N = 5), EER group (N = 9), GUT-103 plus EER group (N = 8), and EER plus GUT-103 group (N = 8). Combined score of cecum, proximal colon, and distal colon/rectum. 1-way ANOVA, Mean ± SE, *P < 0.05, **P < 0.01. f Fecal metabolite profiles for butyrate and propionate in Il10−/− mice inoculated with GUT-103 (N = 5), GUT-103 plus EER (preventive protocol, N = 8), and EER plus GUT-103 (therapeutic protocol, N = 8) compared to EER (N = 8). Mann–Whitney unpaired two-tailed t-test. ±SE, **P < 0.01, ****P < 0.001. g Cecal tissue levels of cytokine mRNA expression of GUT-103 (N = 5), EER (N = 8), GUT-103 plus EER (preventive protocol, N = 8), and EER plus GUT-103 (therapeutic protocol, N = 8). Samples were collected at necropsy. One-way ANOVA, Mean ± SE, *P < 0.05, **P < 0.01. Source data and calculated P-values are provided as a Source Data file.

