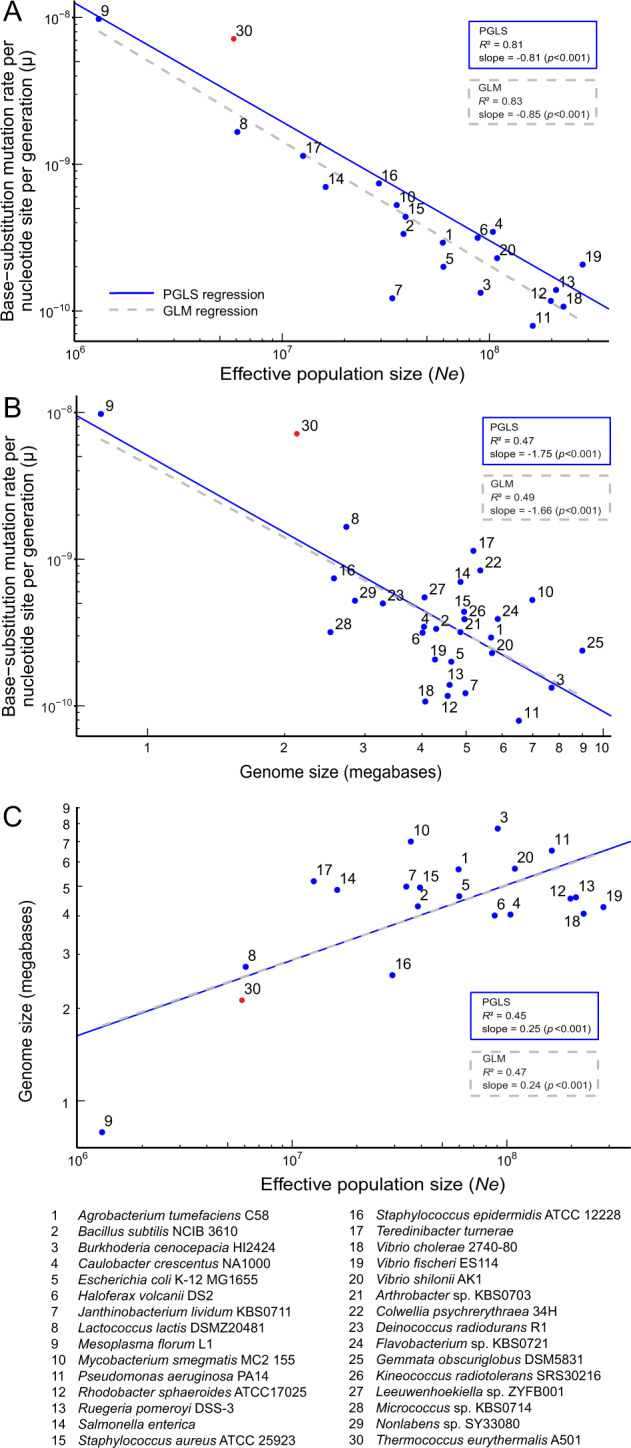
Fig. 2. The scaling relationship involving the base-substitution mutation rate per cell division per site (µ), the estimated effective population size (Ne), and genome size across 28 bacterial and two archaeal species.

All three traits’ values were logarithmically transformed. The mutation rates of these species are all determined with the mutation accumulation experiment followed by whole-genome sequencing of the mutant lines. The mutation rate of species numbered 1–29 (blue) is collected from literature and that of the species 30 (red) is determined in the present study. Among the numbered species shown in the figure, the species #6 Haloferax volcanii is facultative anaerobic halophilic archaeon, and the species #30 is an obligate anaerobic hyperthermophilic archaeon. A The scaling relationship between µ and Ne. B The scaling relationship between µ and genome size. C The scaling relationship between genome size and Ne. Numbered data points 21–29 are not shown in A and C because of the lack of population dataset for estimation of Ne. The dashed gray lines and blue lines represent the generalized linear model (GLM) regression and the phylogenetic generalized least square (PGLS) regression, respectively. The Bonferroni adjusted outlier test for the GLM regression show that #7 Janthinobacterium lividum is an outlier in the scaling relationship between µ and Ne, and #9 Mesoplasma florum is an outlier in the scaling relationship between genome size and Ne. No outlier was identified in the PGLS regression results.
