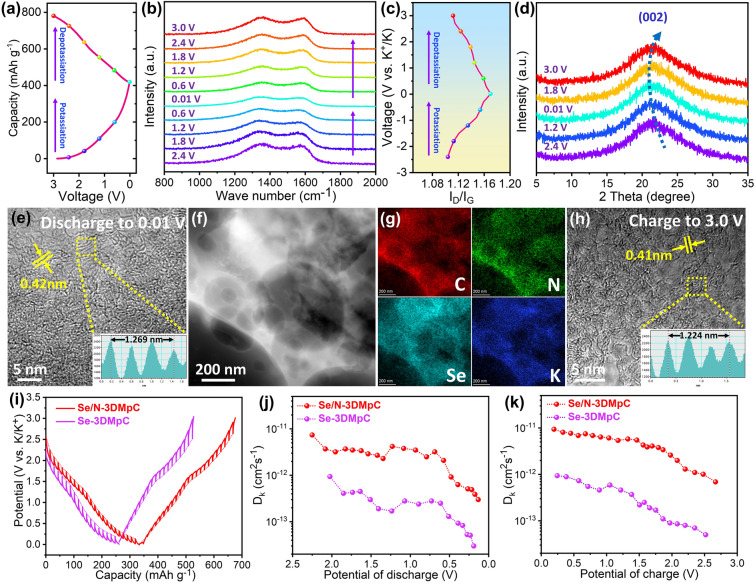
Fig. 4.
a Second discharge/charge cycle and the corresponding voltage position, b ex situ Raman spectra at 0.2 A g−1, c corresponding ID/IG ratio, d ex situ XRD patterns, e HRTEM at fully discharged, f HAADF-STEM image, g elemental mappings, and h HRTEM at fully charged of Se/N-3DMpC. i Galvanostatic intermittent titration technique (GITT) curves of Se/N-3DMpC and Se-3DMpC at the 200th cycles. The K-ion diffusion coefficient of j Se/N-3DMpC and k Se-3DMpC calculated by the GITT during potassiation and depotassiation processes

