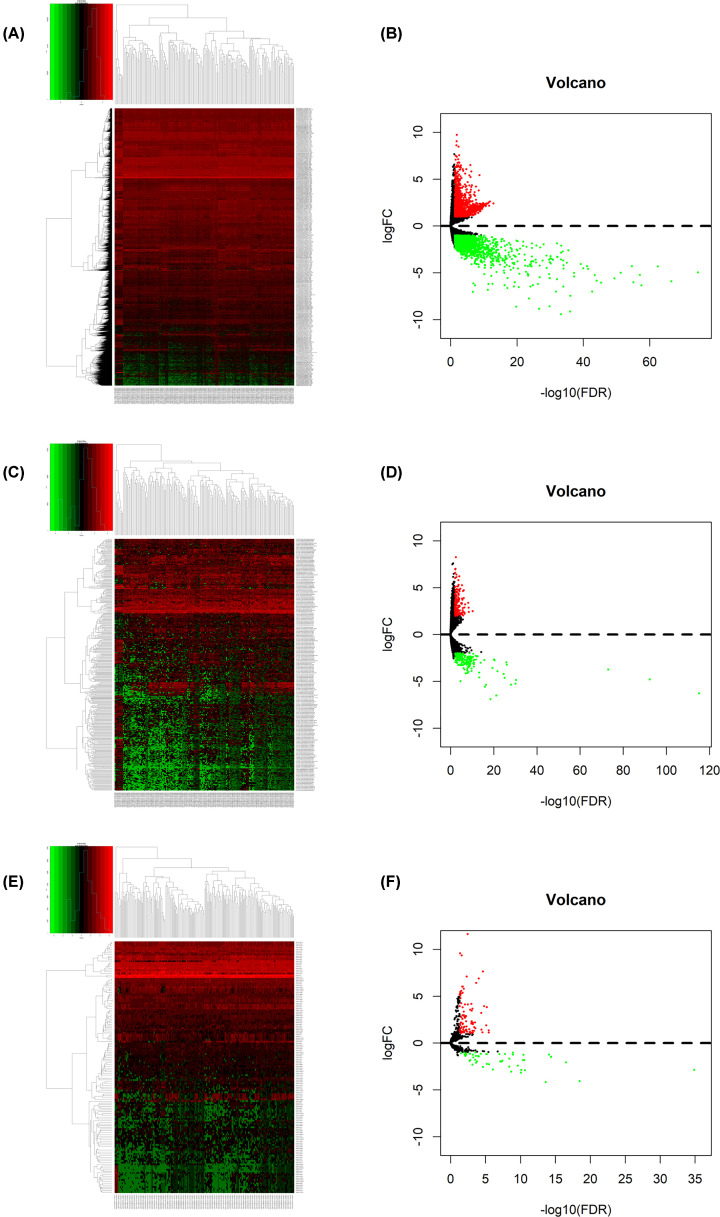
Figure 1. Differentially expressed genes between ESCA samples and normal samples.
(A) Heatmap and (B) volcano plot of differentially expressed mRNAs between normal and tumor samples. (C) Heatmap and (D) volcano plot of differentially expressed lncRNAs between normal and tumor samples. (E) Heatmap and (F) volcano plot of differentially expressed miRNAs between normal and tumor samples. Red points represent up-regulated genes. Green points represent down-regulated genes. Black points represent genes with no significant difference; ESCA, esophageal cancer.

