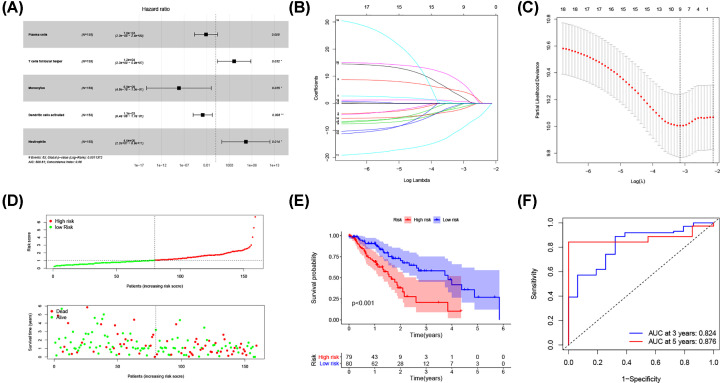
Figure 5. Construction of a prognostic model based on the immune cells.
(A) The results of the multivariate Cox regression. (B) Least absolute shrinkage and selection operator (LASSO) coefficient profiles of the five immune cells. (C) Tuning parameter selection by 10-fold cross-validation in the LASSO model. The partial likelihood deviance was plotted against log(Lambda/λ), and λ was the tuning Parameter. (D) Risk score distribution and survival status. The black dotted line is the optimum cut-off dividing patients into low-risk and high-risk groups. The red curve represents high risk and the green curve represents low risk. The dots indicate the survival status, the red dot indicates the death of the patient, and the green dot indicates alive. (E) Survival curve and (F) ROC curve analyses; ROC, receiver operating characteristic.

