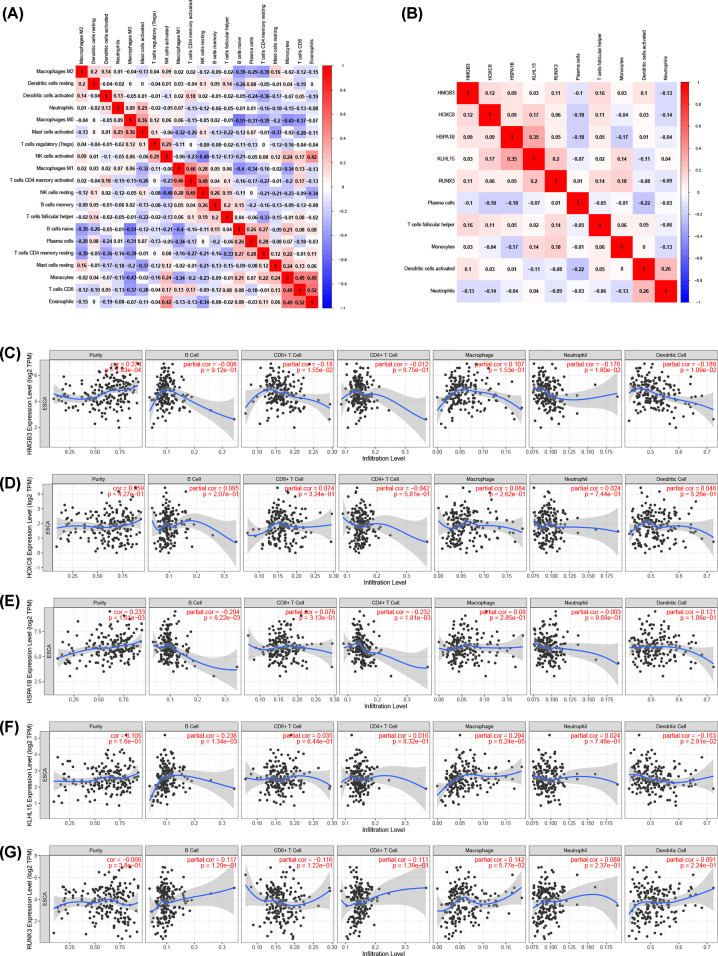
Figure 6. Correlation analysis of the key genes and immune cells.
(A) Correlation heat map of all immune infiltration cells. (B) Correlation heat map of key genes and immune cells involved in the prognostic models. (C–G) Correlation between key genes expression and six types of immune cells in the TIMER database.

