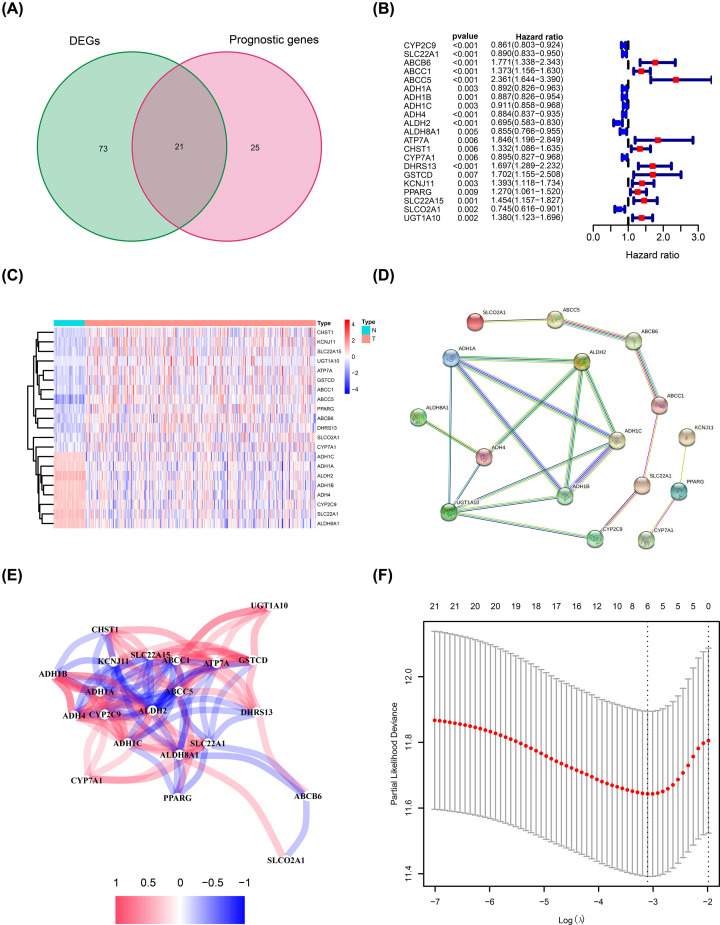
Figure 2. Prediction model construction using ADME-related genes.
(A) Venn plot showing intersection of genes related to OS and differentially expressed in tumor and adjacent normal tissues. (B) Forest plots showing the relationship between expression of intersecting genes and OS. (C) Heatmap showing relative expression of intersecting genes in tumor and adjacent normal tissues. (D) PPI network of intersecting genes. (E) Correlation analysis of intersecting genes. (F) Prediction model construction using LASSO regression analysis.

