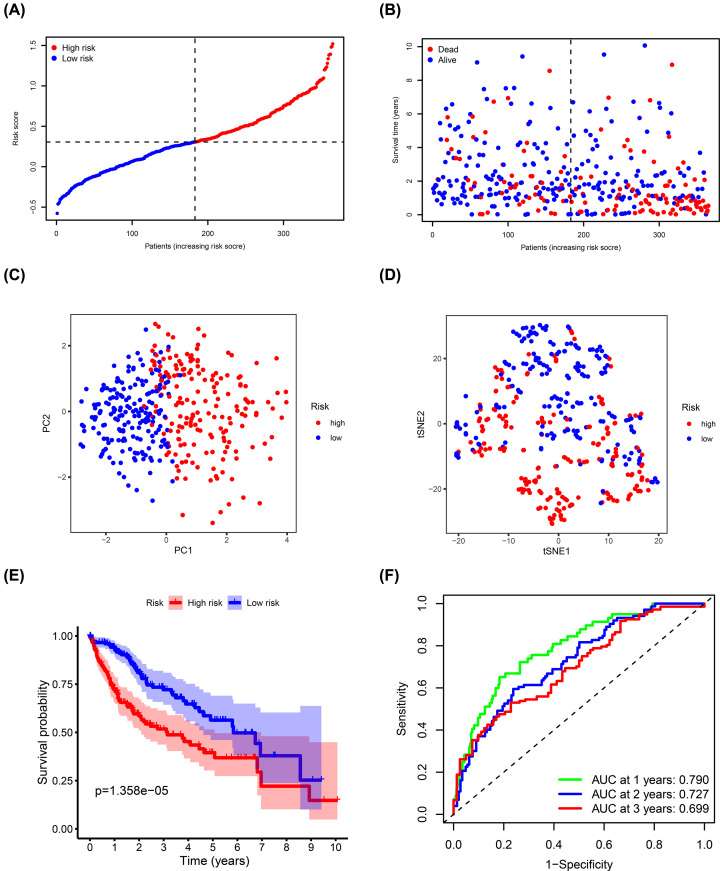
Figure 4. Estimation of ADME-related risk signature using the TCGA cohort.
(A) Distribution of risk scores. (B) Distribution of survival status, survival time, and risk scores. (C) PCA of risk scores. (D) t-SNE analysis of risk scores. (E) Kaplan–Meier curves for OS of patients in the high- and low-risk groups. (F) ROC curves and AUCs showing the predictive performance of the risk signature.

