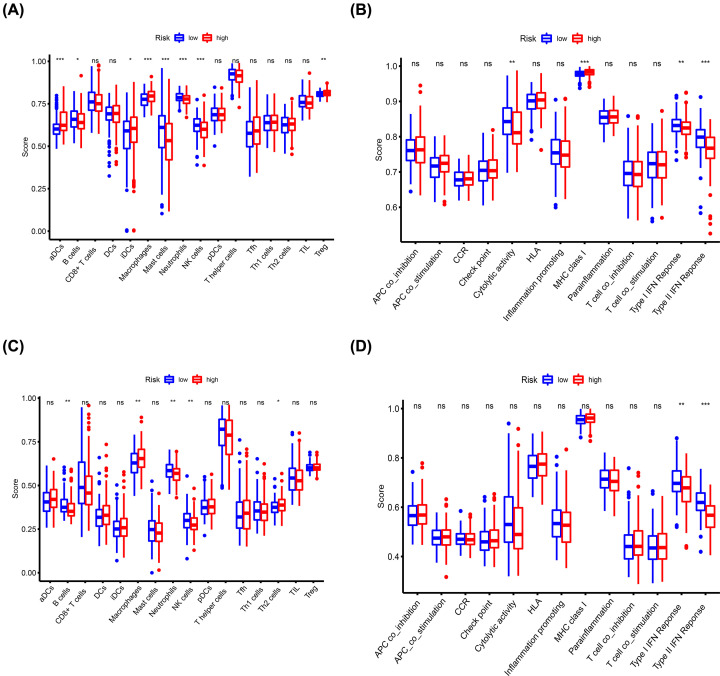
Figure 8. Comparison of the enrichment scores for immune status between the high- and low-risk groups based on ssGSEA.
Scores of 16 immune cells in the TCGA (A) and ICGC (C) cohorts. Scores of 13 immune-related functions or pathways in the TCGA (B) and ICGC (D) cohorts. Abbreviation: CCR, cytokine–cytokine receptor. *P<0.05, **P<0.01, ***P<0.001.

