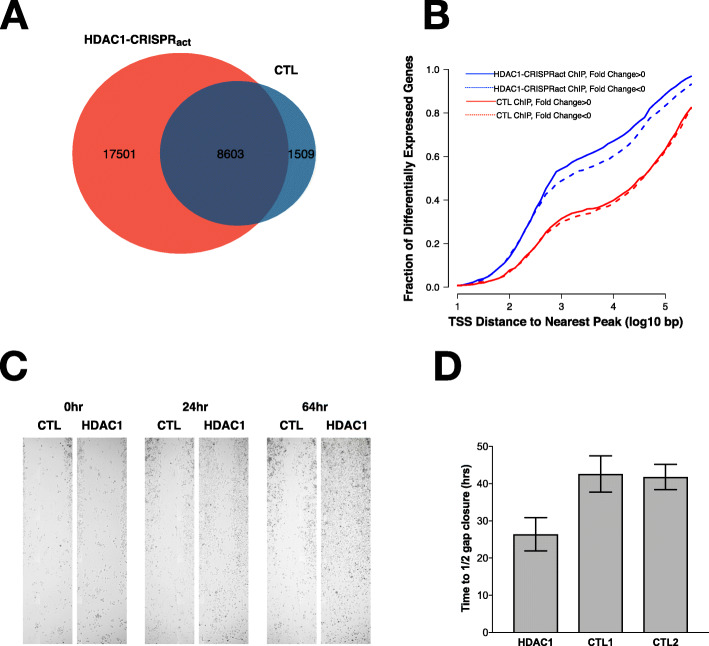
Fig. 5.
A ChIP-seq analysis reveals ChIP-seq peaks in the control (CTL) MiaPaCa-2 cells overlap significantly with MiaPaCa-2 cells over-expressing HDAC1 (red). An additional 17,501 peaks are identified with overexpression of HDAC1. B Cumulative distribution plot showing that HDAC1 binding sites identified upon overexpression of HDAC1 (blue) are nearby transcription start sites (TSS) of differentially expressed genes. C Scratch assay shows that overexpression of HDAC1 leads to increased migration compared to control cells. D Quantification of the scratch assays shows a significant difference with HDAC1 overexpression (Student’s T-test)

