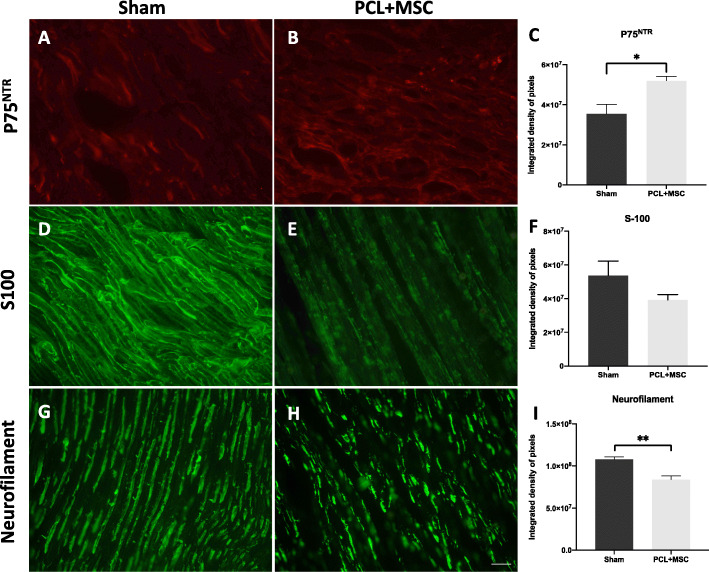
Fig. 8.
Fluorescence intensity analysis of p75NTR, S100, and neurofilament on sciatic nerve at 30 days in both sham and PCL + MSC groups. a–c Expression of the receptor p75NTR in the proximal region of the nerve and integrated pixel density analysis. d–f Expression of the Schwann cell marker S-100 in the proximal region of the nerve and integrated pixel density analysis. g–i Expression of neurofilament in the proximal region of the nerve and integrated pixel density analysis. The values of the integrated pixel density are represented as mean ± SEM. p < 0.05*; p < 0.01**; p < 0.001***. Scale bar: 50 μm

