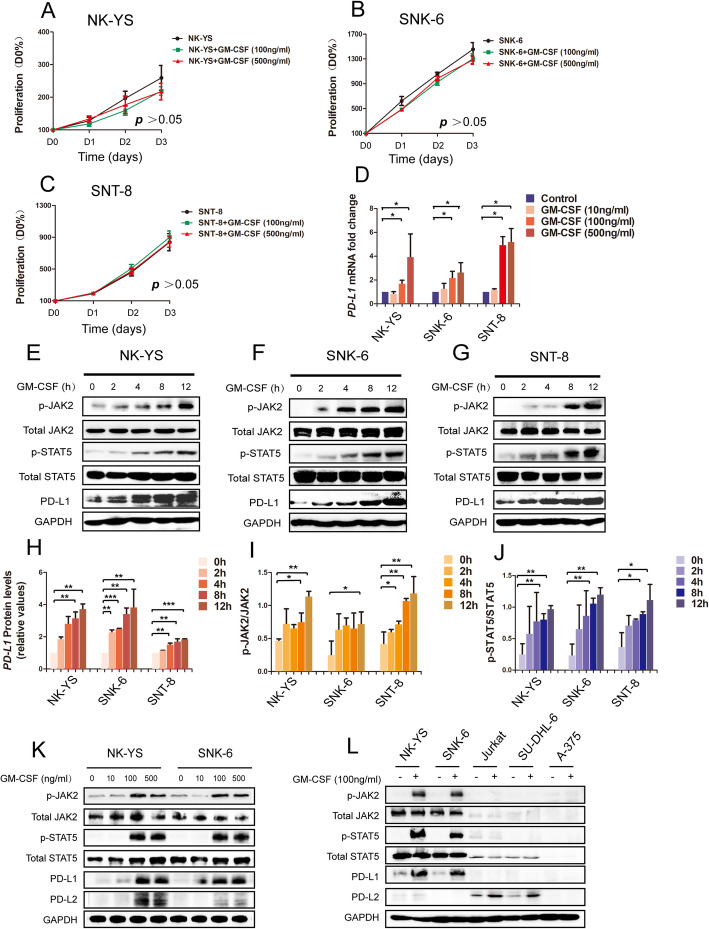
Fig. 3.
JAK/STAT activation directly drives PD-L1 expression in ENKTL. a-c The proliferation of NK-YS, SNK-6, and SNT-8 cells treated by different concentrations of GM-CSF (100 ng/ml and 500 ng/ml). The above assay was determined by CCK8 as described in materials and methods. Each point represents the mean ± standard deviations (SDs) of three independent experiments performed. d Relative mRNA expression levels of PD-L1 were increased by GM-CSF (10 ng/ml, 100 ng/ml, and 500 ng/ml) treatment in NK-YS, SNK-6, and SNT-8 cells. e-g NK-YS, SNK-6, and SNT-8 cells were treated with GM-CSF (100 ng/ml) for 0, 2, 4, 8, 12 h, p-JAK2, JAK2, p-STAT5, STAT5, and PD-L1 protein expression was measured by Western blot. d Relative protein expression levels of PD-L1 were increased by GM-CSF (100 ng/ml) treatment in NK-YS, SNK-6, and SNT-8 cells. i, j The ratio of protein expression of p-JAK2 to JAK and ratio of protein expression of p-STAT5 to STAT5 in ENKTL cell lines (NK-YS, SNK-6, and SNT-8) treated with GM-CSF (100 ng/ml) for 0, 2, 4, 8, 12 h. k ENKTL cell lines NK-YS and SNK-6 were treated by GM-CSF (10 ng/ml, 100 ng/ml, and 500 ng/ml). The protein expressions of p-JAK2, JAK2, p-STAT5, STAT5, and PD-L1 were detected by Western blot. l ENKTL cell lines NK-YS and SNK-6, T-cell lymphoblastic lymphoma/leukemia cell line Jurkat, B-cell lymphoma cell line SU-DHL-6, and melanoma cell line A375 were treated by GM-CSF (100 ng/ml). The protein expressions of p-JAK2, JAK2, p-STAT5, STAT5, PD-L1, and PD-L2 were detected by Western blot. * P < 0.05, ** P < 0.01, *** P < 0.001. Error bars represent SD of three independent experiments

