Fig. 1.
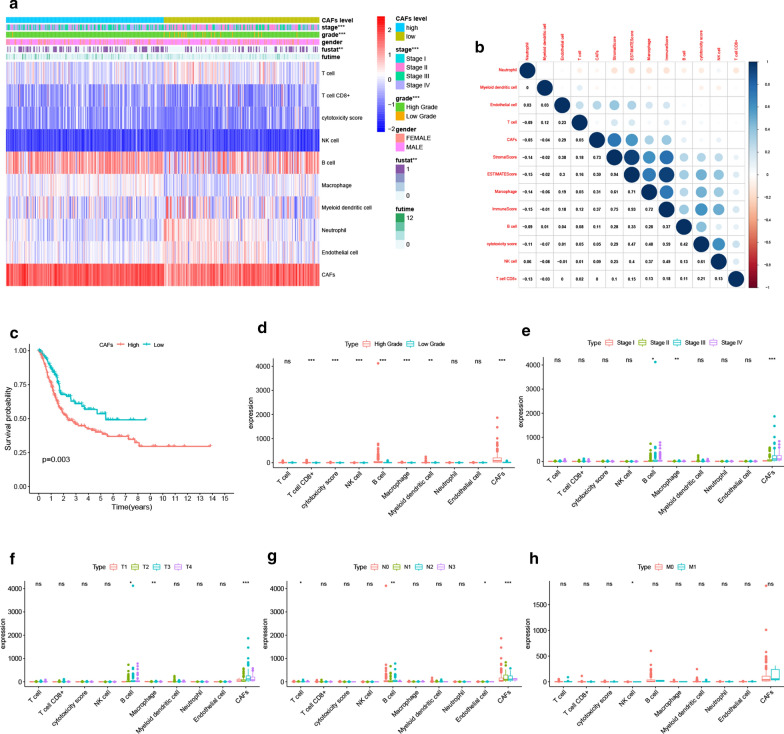
CAFs abundance affected BLCA progression in the TCGA cohort. a The abundance of different cell types calculated by MCP-COUNTER was shown in the heatmap. There were significant differences in tumor stage, grade and patient survival status between the high and low CAFs groups. b After the correlation analysis, close correlations of CAFs with stromal scores (R = 0.73), immune score (R = 0.37), and ESTIMATED score (R = 0.59) were observed. c Kaplan-Meier survival analysis demonstrated that patients with high CAFs abundance exhibited significant lower OS compared to low CAFs patients (p = 0.003). d–h Different CAFs abundance was observed regarding BLCA grade (p < 0.001), stage (p < 0.001), T (p < 0.001) and N (p < 0.001) classification

