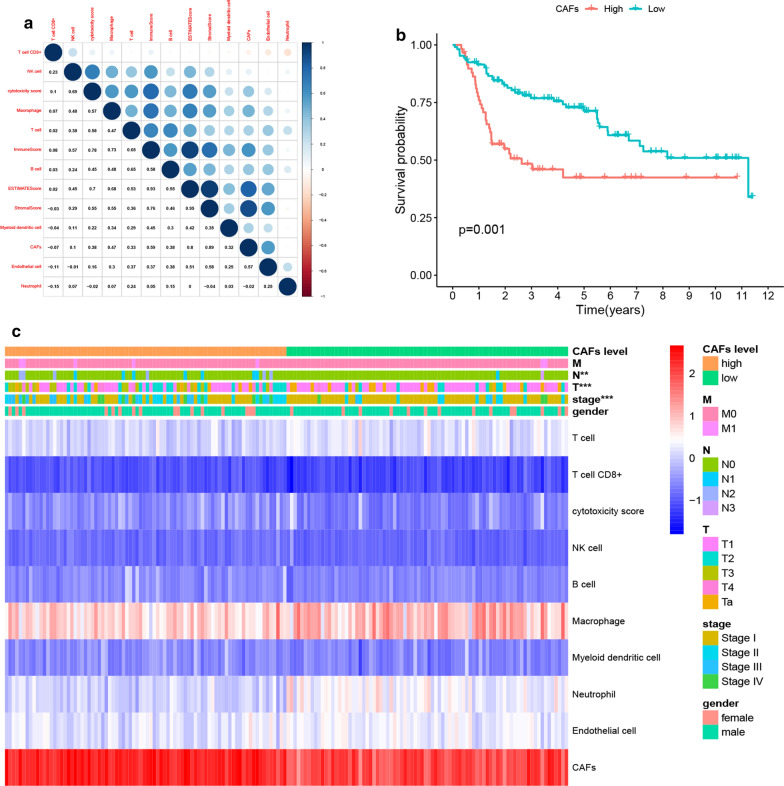
Fig. 2.
Validation of the influence of CAFs abundance on BLCA progression in GEO cohort. a The correlation of TME cell types with ESTIMATE scores in the GEO cohort. High correlations between CAFs, stromal score (R = 0.89), immune score (R = 0.59) and ESTIMATE score (R = 0.80) were also observed. b Kaplan-Meier survival curves of high vs. low CAFs abundance in patients of GEO cohort. Patients in the high CAFs group presented a significantly lowered OS (p = 0.001). c The expression of each TME cell was shown after grouping by CAFs. Significant differences were found in stage, T and N classification between CAFs low and high abundance groups

