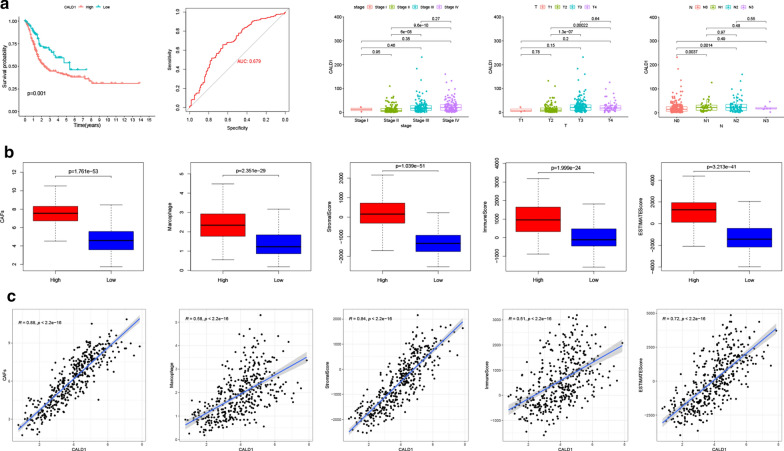
Fig. 5.
CALD1 regulated the TME and promoted the progression of BLCA. a Kaplan-Meier curves of OS between high and low CALD1 group using Log-Rank test in TCGA BLCA cohort. ROC curve demonstrated the accuracy of CALD1 in predicting cancer progression, with an AUC of 0.679. The expression of CALD1 was significantly elevated with cancer progression. Three different bar plots showed the expression level of CALD1 in different tumor stages, T and N classification, respectively. b CAFs (p < 0.001), macrophages (p < 0.001), stromal score (p < 0.001), immune score (p < 0.001) and ESTIMATE score (p < 0.001) in the CALD1 high expression group were significantly higher than those in the CALD1 low expression group. c Close relationships of CALD1 with CAFs (R = 0.88, p < 0.001), Macrophages (R = 0.58, p < 0.001), stromal score (R = 0.84, p < 0.001), immune score (R = 0.51, p < 0.001) and ESTIMATE score (R = 0.72, p < 0.001) were observed in the TCGA cohort

