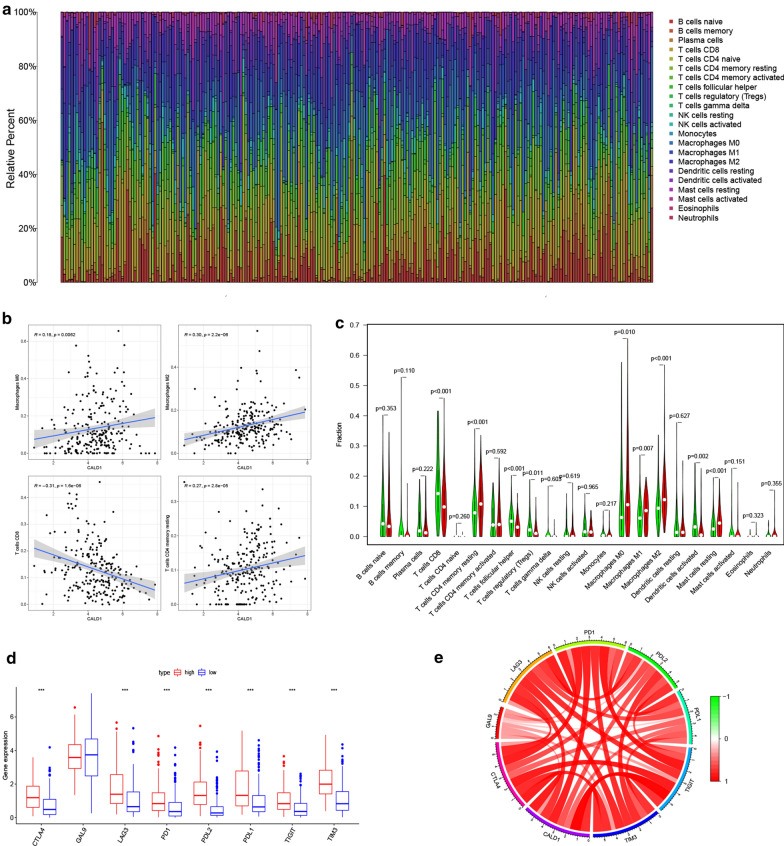
Fig. 6.
CALD1 was significantly associated with a variety of TIICs and immune checkpoint related molecules. a The relative percentage of 22 kinds of TIICs calculated by the CIBERSORT algorithm was shown in the bar plot. b CALD1 was positively correlated with macrophages M0 (R = 0.18, p = 0.006), macrophages M2 (R = 0.30, p < 0.001), T cells CD4 memory resting (R = 0.27, p < 0.001), and negatively correlated with T cells CD8 (R=-0.31, p < 0.001). c The difference in infiltrated levels of TIICs between low and high CALD1 expression groups. d Higher expression levels of CTLA4 (p < 0.001), LAG3 (p < 0.001), PD-1 (p < 0.001), PD-L1 (p < 0.001), PD-L2 (p < 0.001), TIGIT (p < 0.001) and TIM3 (p < 0.001) were observed in the high CALD1 group compared with low CALD1group. eClose relationships between CALD1 and immune checkpoint-related genes in the TCGA cohort

