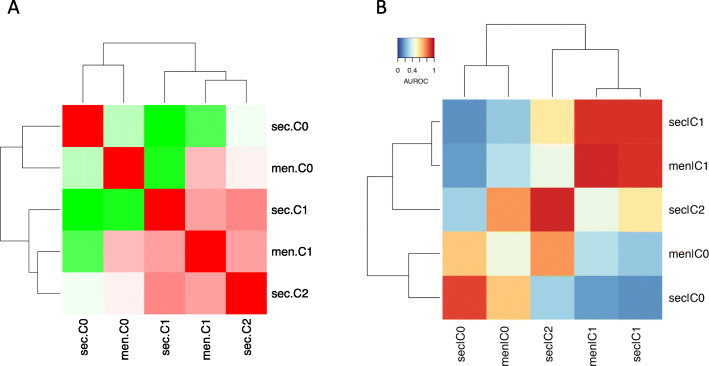
Fig. 5.
Cell identity replicability analysis identifies similarity between cultured menstrual and secretory ePCs. a Heat map of the Pearson correlation coefficient between sub-clusters from menstrual and secretory. All the values were scaled. sec., secretory; men., menstrual. Pearson correlation coefficient of each comparison: men.C0-sec.C0: 0.91; men.C0-sec.C1: 0.86; men.C0-sec.C2: 0.94; men.C1-sec.C0: 0.88; men.C1-sec.C1: 0.95; men.C1-sec.C2: 0.95. b Heatmap of the mean AUROC (area under the receiver operator characteristic curve) scores for identified sub-clusters between menstrual and secretory ePCs. AUROC scores of each comparison: men.C0-sec.C0: 0.65; men.C0-sec.C1: 0.27; men.C0-sec.C2: 0.74; men.C1-sec.C0: 0.18; men.C1-sec.C1: 0.89; men.C1-sec.C2: 0.43

