Fig. 6.
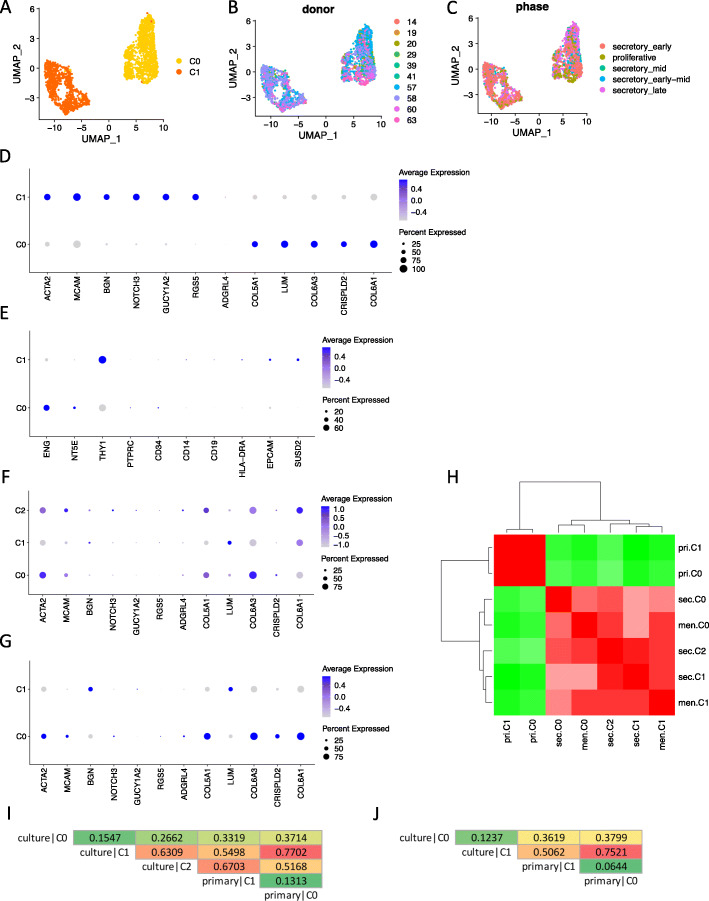
ePCs undergoes extensive changes upon culture. a UMAP plot of the cellular sub-clusters identified from primary PDGFRB+MCAM+ endometrial cells. Single cells are color coded by cluster annotation. b UMAP plot showing the distribution of cells color coded by donor. c UMAP plot showing the distribution of cells color coded by menstrual phases assigned by the published study. d Dot plot showing the expression of perivascular cell markers, and stromal fibroblast cell markers used in the published study across sub-clusters of primary PDGFRB+MCAM+ endometrial cells. e Dot plot showing the expression of MSC definition markers, epithelia cell marker EPCAM, and another eMSC enrichment marker SUSD2 across sub-clusters of primary PDGFRB+MCAM+ endometrial cells. f Dot plot showing the expression of perivascular cell markers, and stromal fibroblast cell markers used in the published study across sub-clusters of secretory ePCs. g Dot plot showing the expression of perivascular cell markers, and stromal fibroblast cell markers used in the published study across sub-clusters of menstrual ePCs. h Heat map of the Pearson correlation coefficient between sub-clusters from menstrual, secretory ePCs, and primary PDGFRB+MCAM+ endometrial cells. i AUROC scores between sub-clusters of secretory ePCs and of primary PDGFRB+MCAM+ endometrial cells. The scores are color-scaled. j AUROC scores between sub-clusters of menstrual ePCs and of primary PDGFRB+MCAM+ endometrial cells. The scores are color-scaled

