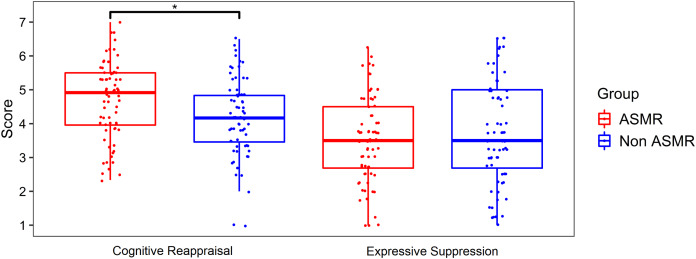
Figure 1. Plot of ASMR and non-ASMR scores in the emotion regulation questionnaire.
Box-plot shows the scores of the two Emotional Regulation Questionnaire’ subscales for the ASMR (n = 68) and non-ASMR (n = 68) groups. Group difference is significant only for the cognitive reappraisal subscale. Jittered points are individual subjects. An asterisk (*) indicates a significant difference (p < 0.01).

