
Figure 1. Severe seizures induce microglial process pouch formation.
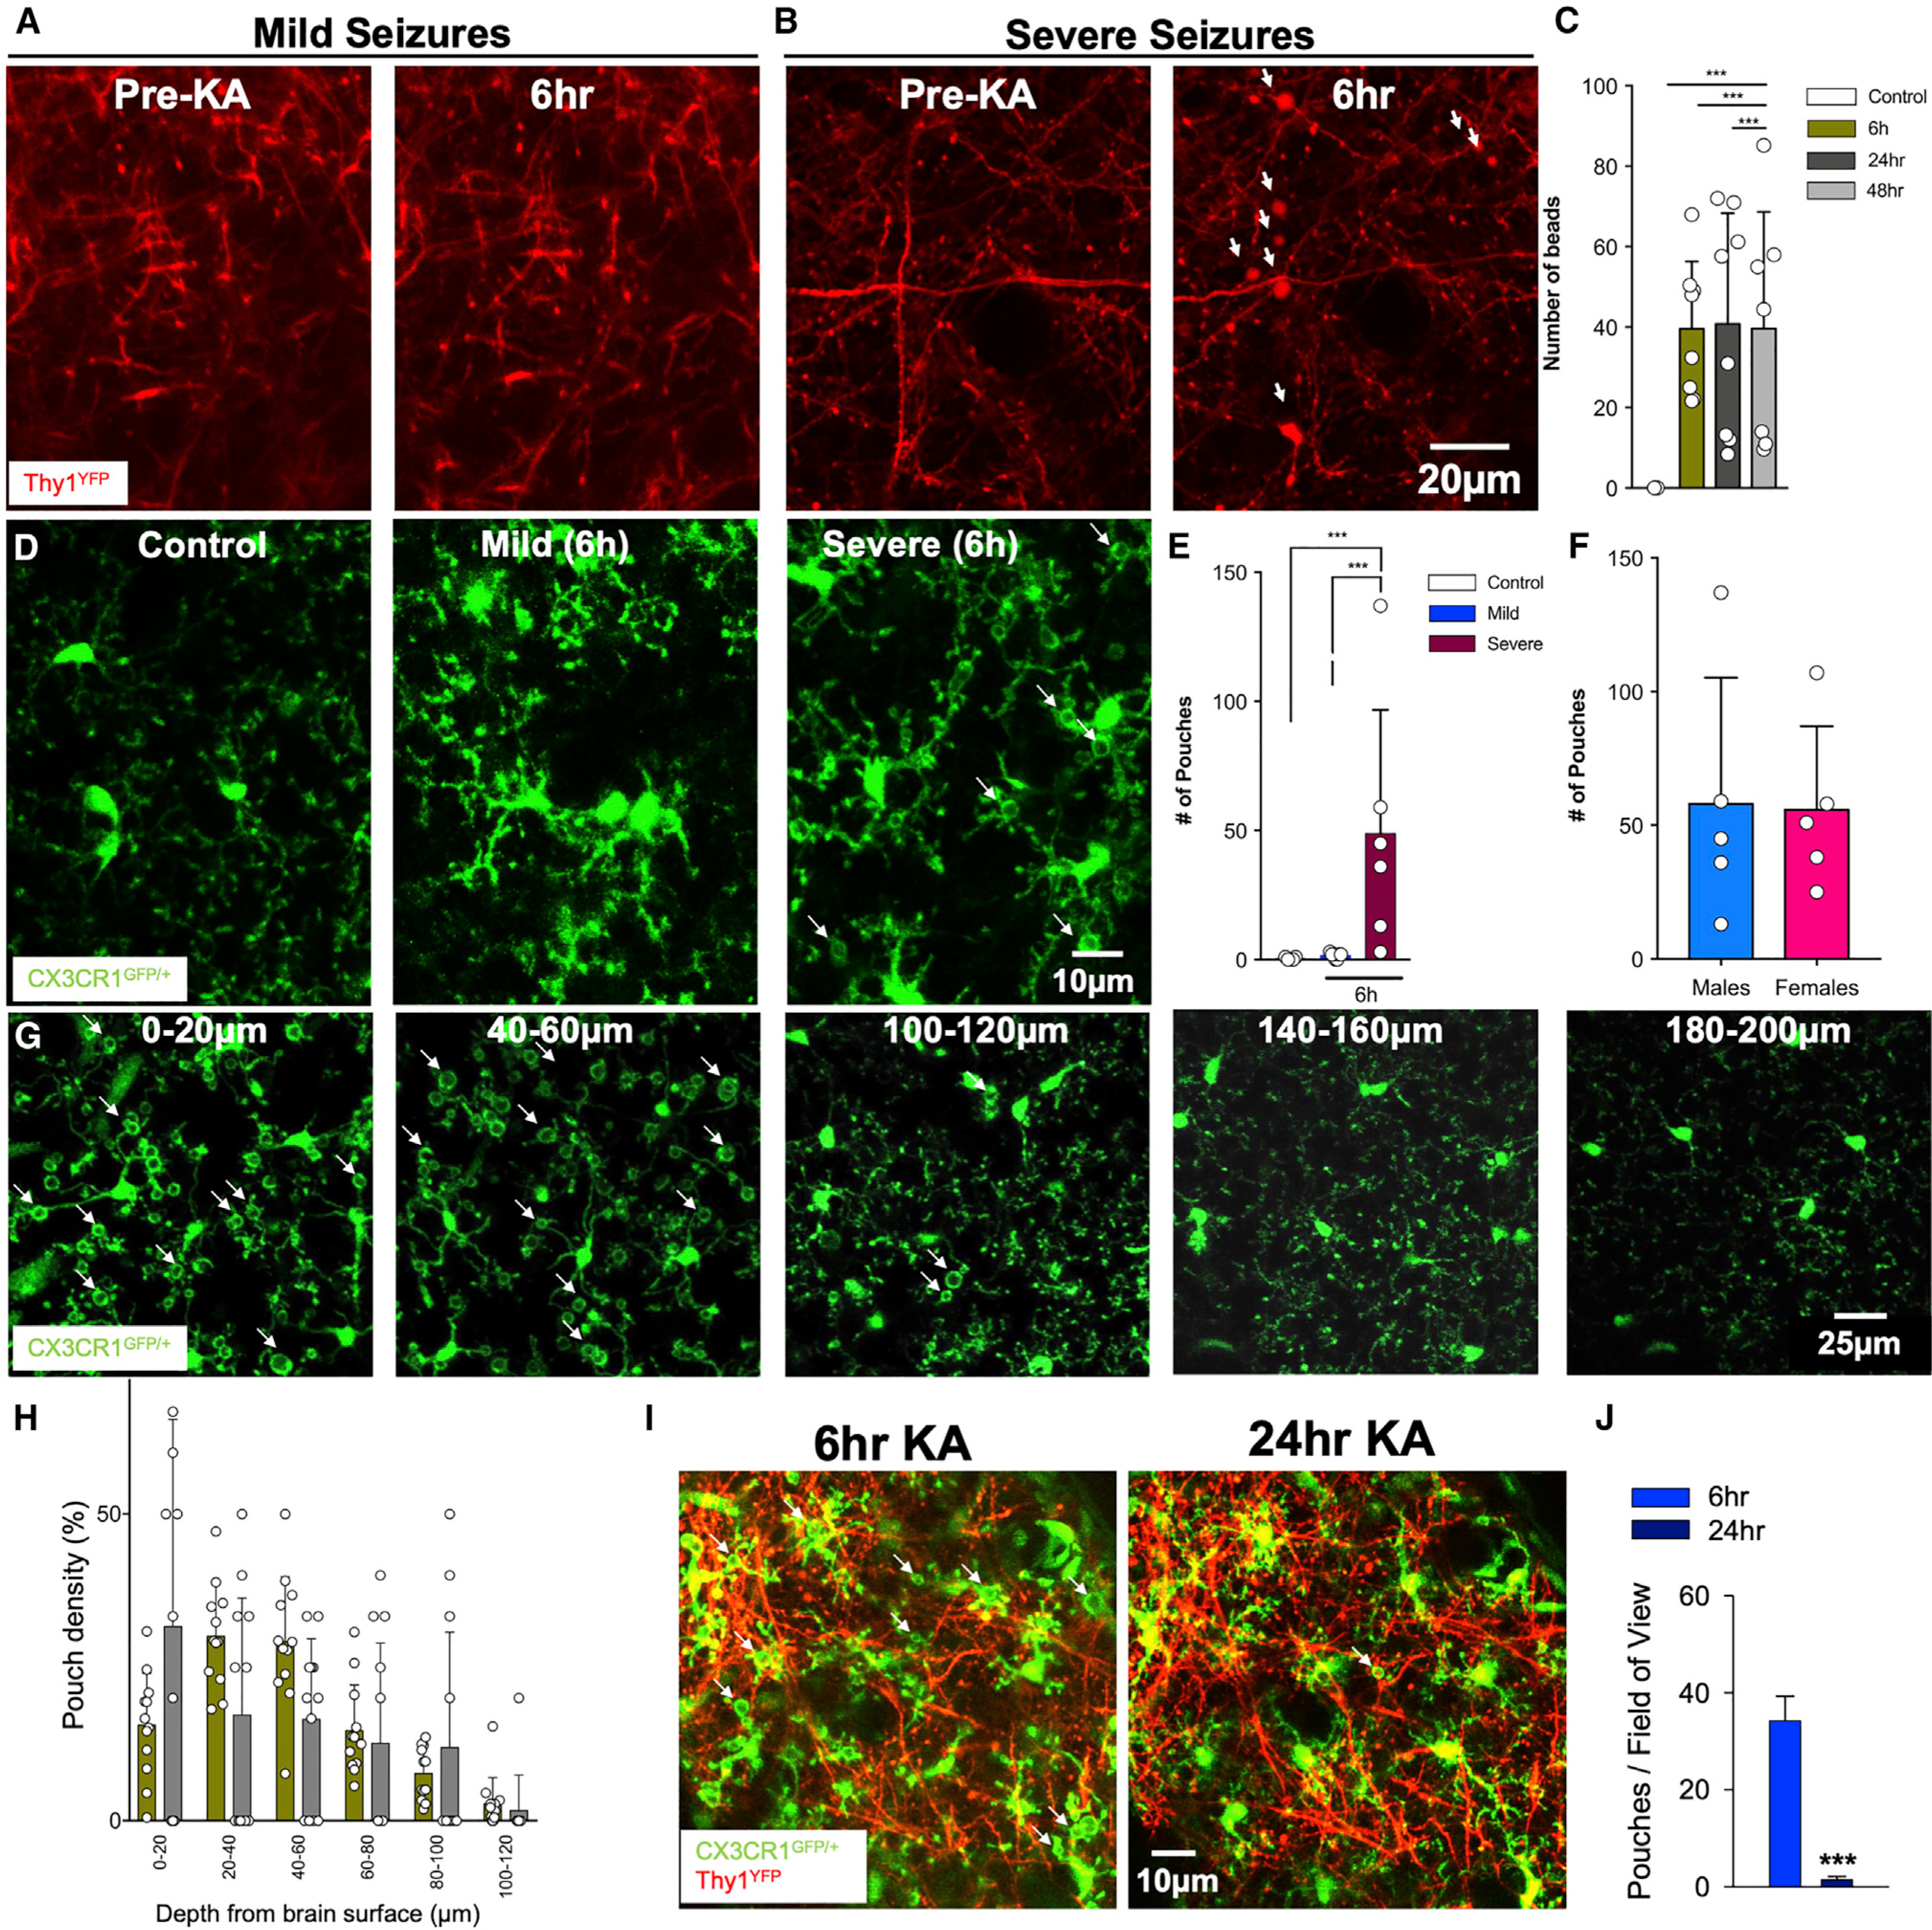
(A) Representative two-photon in vivo images through a chronically implanted cranial window from a Thy1YFP mouse before and following mild (stage 3) seizures with unperturbed dendrites.
(B) Representative two-photon in vivo images through a chronically implanted cranial window from a Thy1YFP mouse before and following severe (stage 5) seizures with beaded dendrites (white arrows). Scale bar: 20 μm.
(C) Quantification of dendritic beads at different times of KA-induced seizures.
(D) Representative two-photon in vivo images from CX3CR1GFP/+ mice following an acute craniotomy showing microglia in the superficial somatosensory cortex of control, mild, and severe seizures following kainic acid (KA) treatment. Microglial process pouches are identified (white arrows). Scale bar: 10 μm.
(E) Quantification of microglial pouches under different conditions.
(F) Quantification of microglial pouches in male and female mice.
(G) Representative two-photon in vivo images at 6 h of KA treatment at different cortical depths showing microglial process pouches (white arrows). Scale bar: 25 μm.
(H) Quantification of the percent of pouches at different depths at 6 h and 24 h of KA treatment.
(I) Representative two-photon in vivo images through a chronically implanted window showing microglia in a specific field of view before and after severe KA-induced seizures. Pouches (arrows) formed at 6 h are mostly resolved by 24 h. Scale bar: 10 μm.
(J) Quantification of pouches in the same field of view between 6 h and 24 h (n = 3 mice each). Data are presented as mean ± SEM.