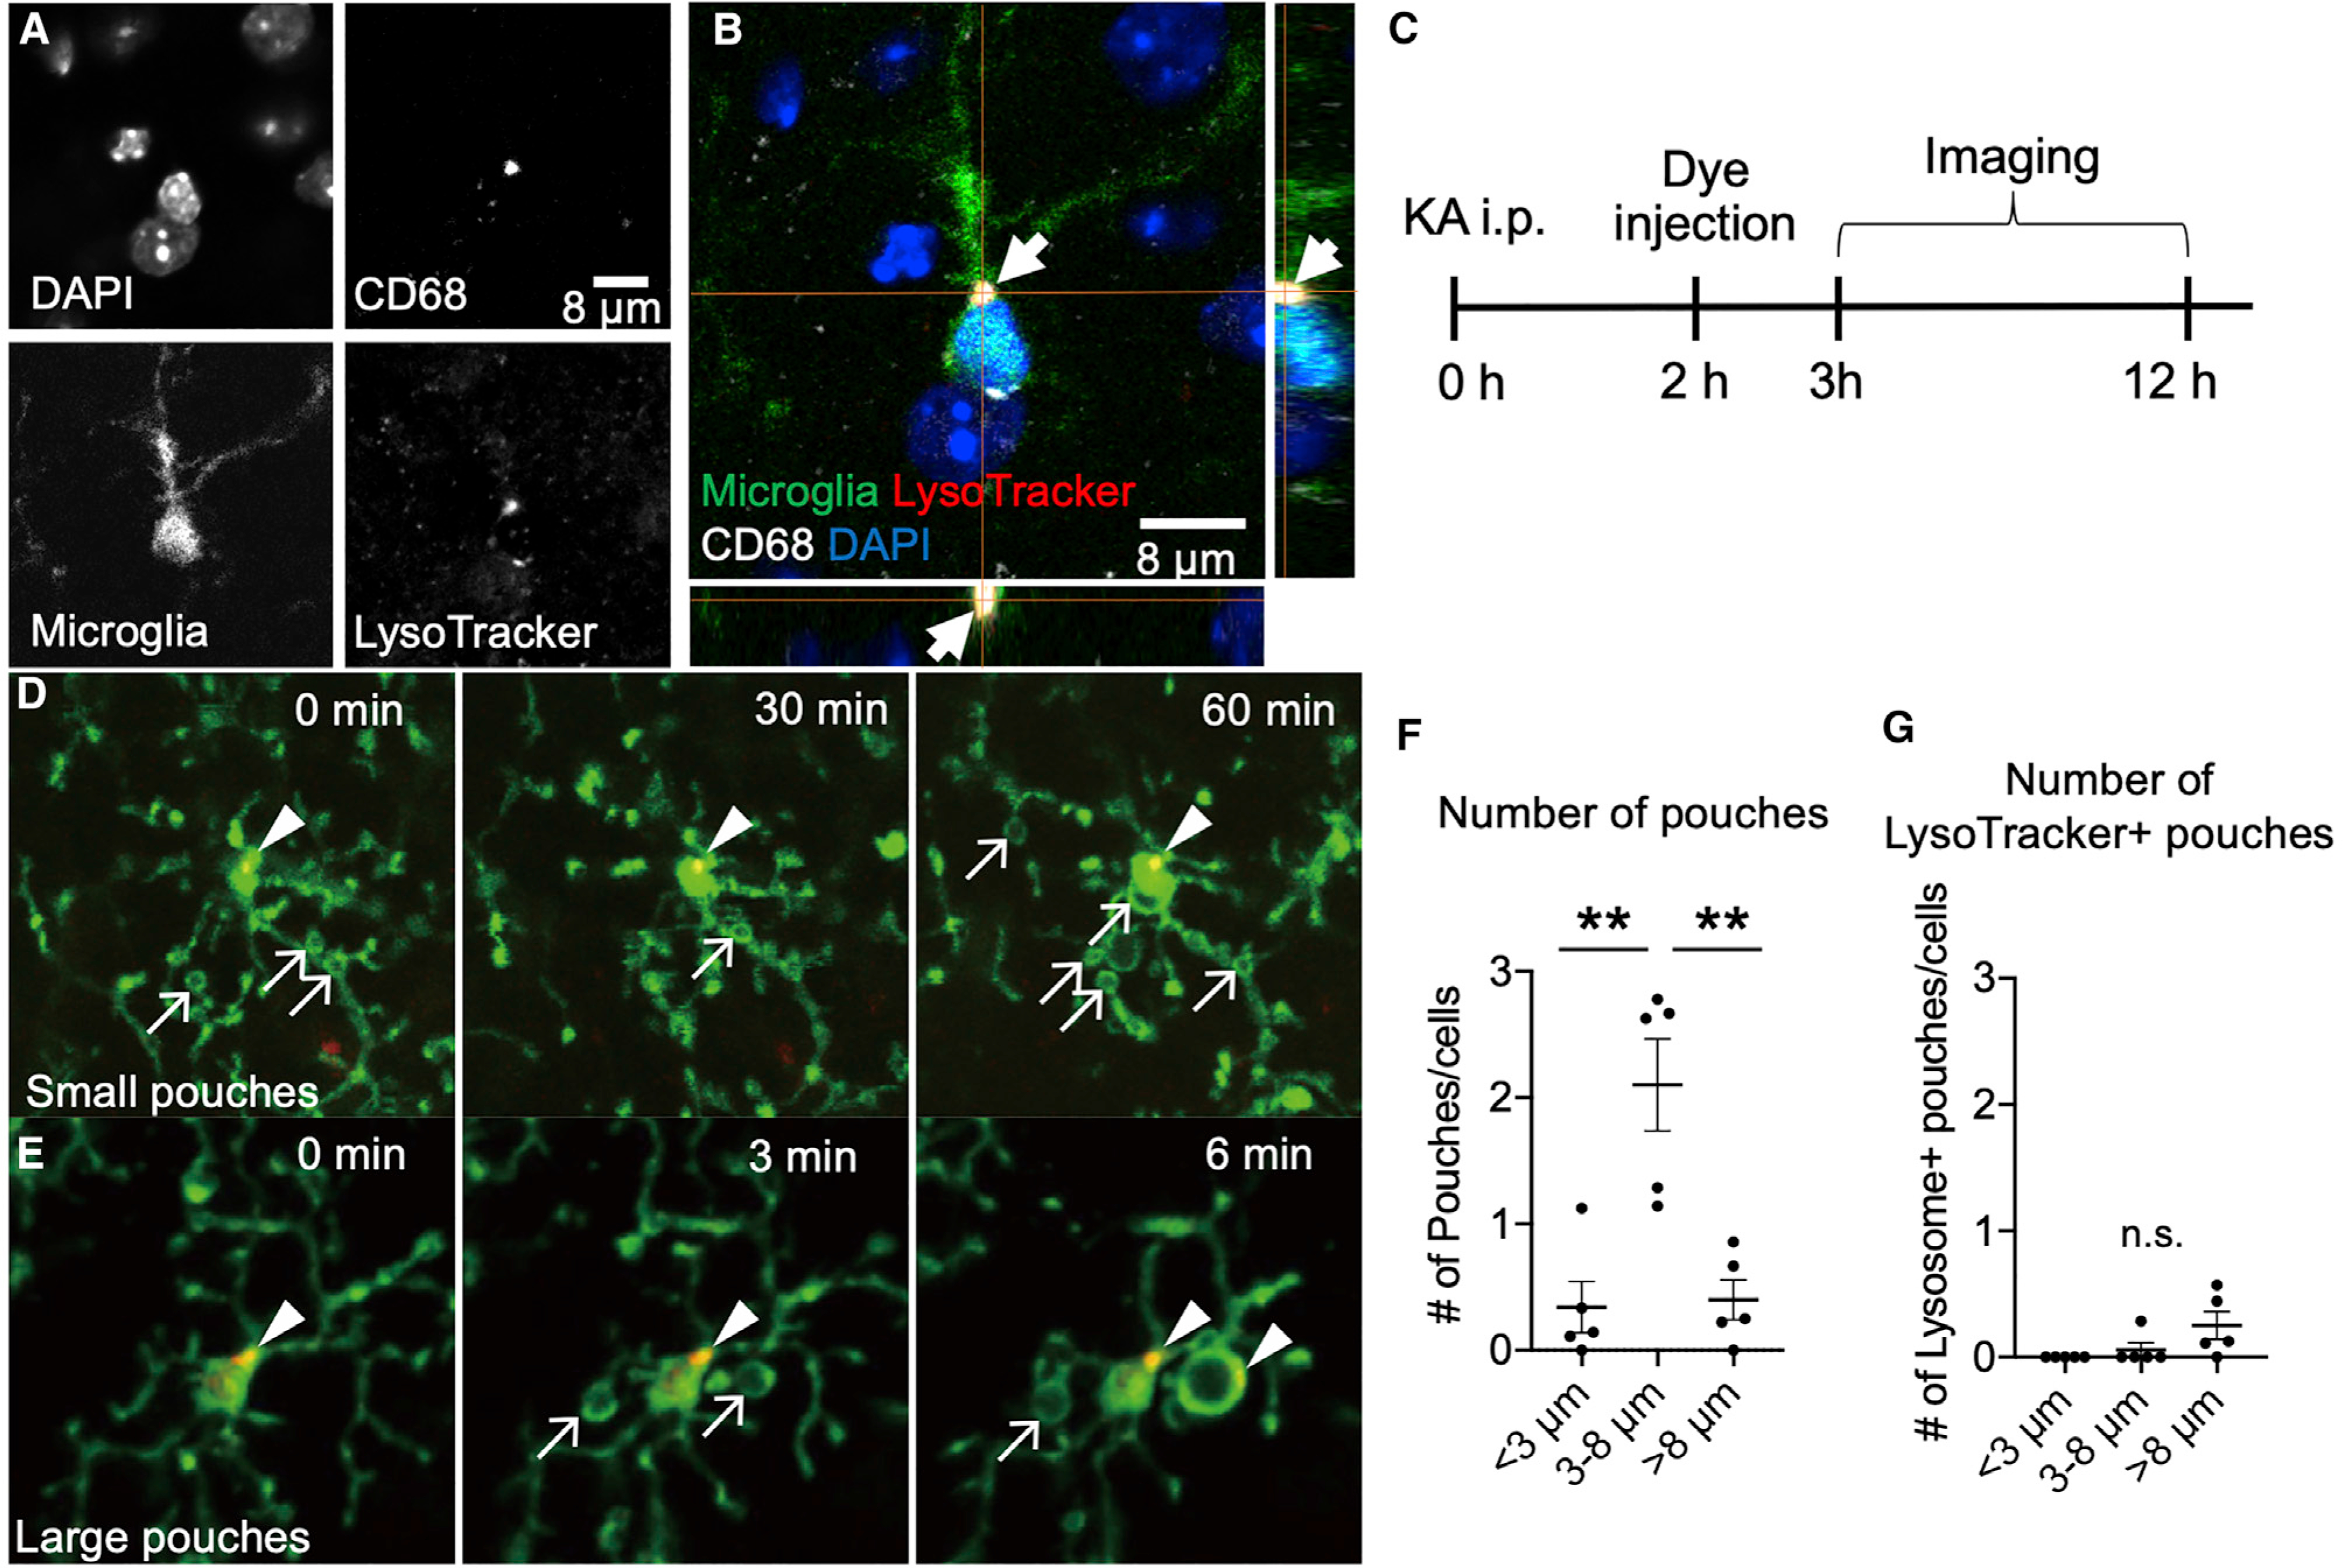
Figure 4. Microglial process pouches do not show phagocytic lysosomal activity.

(A–C) Representative confocal image of a fixed slice stained with DAPI, CD68, CX3CR1-GFP, and LysoTracker.
(D and E) Representative two-photon in vivo images from CX3CR1GFP/+ mice after KA treatment and treated with LysoTracker. Arrows indicate pouches, and arrowheads indicate LysoTracker label. Scale bar: 10 μm.
(F) Quantification of the number of pouches of various sizes observed.
(G) Quantification of the number of LysoTracker+ pouches of various sizes observed. Data are presented as mean ± SEM.
