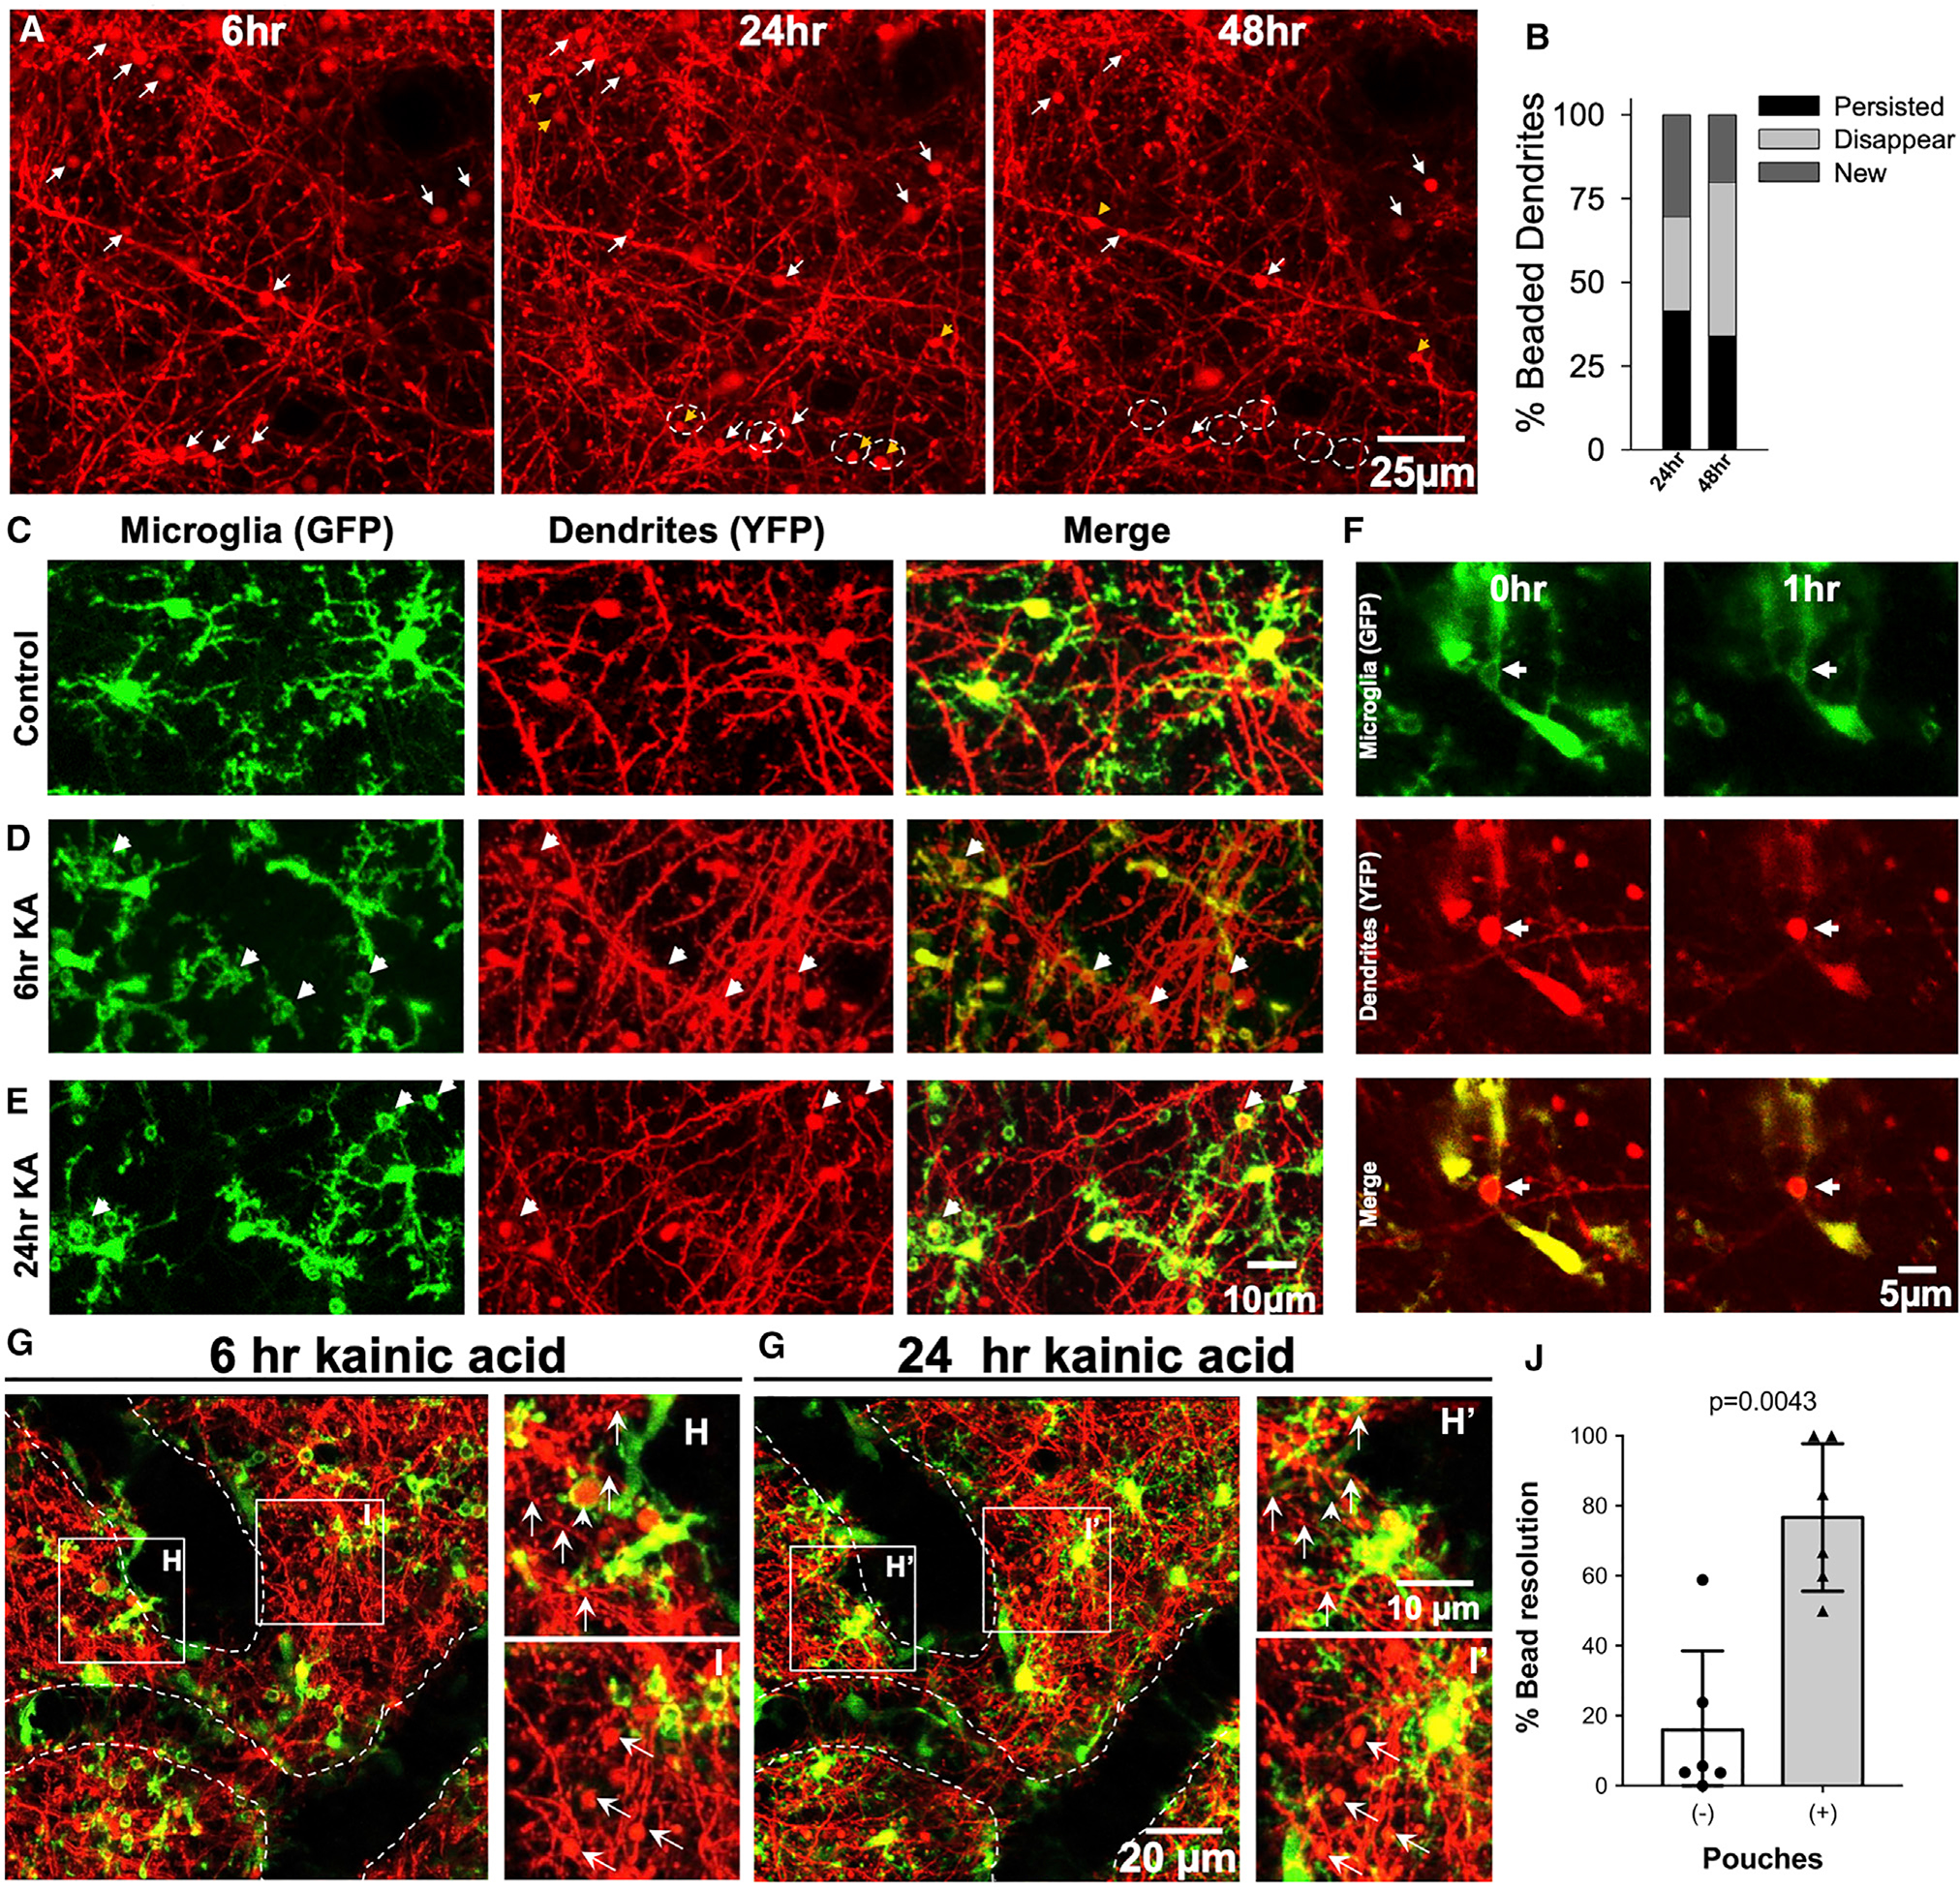
Figure 5. Seizure-induced microglial process pouches target neuronal dendrites for resolution.

(A) Representative two-photon in vivo images through a chronically implanted cranial window from a Thy1YFP mouse from 6 to 48 h after severe (stage 5) seizures showing beaded dendrites, of which some persist (white arrows) and others are newly formed (yellow arrowhead) or disappear (dashed circles). Scale bar: 25 μm.
(B) Graphical quantification of the percentage of beaded dendrites that persist, are newly formed, or disappear between 6 and 48 h of severe (stage 5) seizures. Related to Figure 1.
(C–E) Representative two-photon in vivo images from CX3CR1GFP/+:Thy1YFP mice showing microglial pouches localized around swollen dendrites (arrows) at 6 h and 24 h after KA treatment. Scale bar: 5 μm.
(F) Representative two-photon in vivo images from a time-lapse movie collected from a CX3CR1GFP/+:Thy1YFP mouse showing a microglial pouch shrinking with the wrapped beaded dendrite that also shrinks (arrows). Scale bar: 5 μm.
(G–I’) Representative two-photon in vivo images through a chronically implanted cranial window from a CX3CR1GFP/+:Thy1YFP mouse showing dendritic beads with or without microglia at 6 h and 24 h. Data are presented as mean ± SEM. Scale bar: 20 μm in (G’) and 10 μm in (H’).
(J) Quantification of the percentage of dendritic bead resolution between 6 h and 24 h with or without microglial pouch contacts (n = 6 fields of view from 2 mice).
