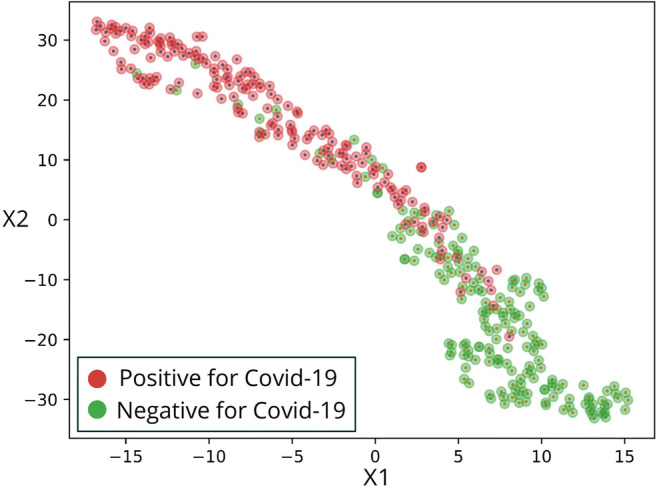
Fig. 3.

t-Distributed stochastic neighbor embedding (t-SNE). A high-dimensional feature vector was extracted for each image from the last layer before the network output, and reduced into 2 dimensions. Each point on the graph represents the features of an image after dimension reduction and arrangement in space. Next the images were colored according to their ground truth (GT), thus revealing two main clusters. The clusters are mostly in one color each, which essentially shows a strong association of the features, extracted from the decision layer and are used to arrange in space, with the GT of the images, represented by the colors
