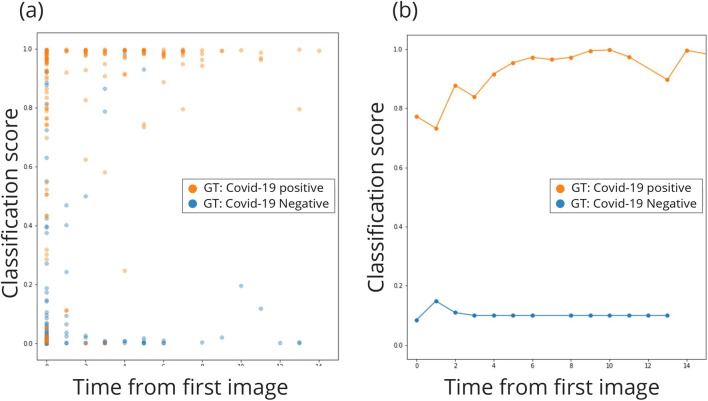
Fig. 4.
Classification score as a function of time change. The first image of each patient was acquired at the same day of first admission; we note that time value as day 0. Other images of patients which were scanned more than once were noted with time value according to the number of days since the first image was acquired, thus representing the time elapsed from first admission and is ordered on the x-axis. The y-axis shows the classification score of each image between 0 (= negative for COVID-19) and 1 (= positive for COVID-19), such that a score closer to the edge indicates more confidence in the network’s classification. a The classification score with respect to change in time. The more days elapse since first admission, the more confident the classification. b Mean values of classification scores for all images of the same day value

