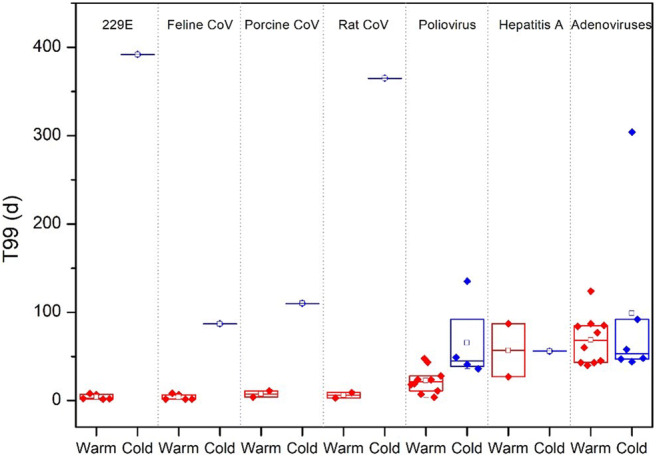
Fig. 3.

Durations of survival, based on 99% inactivation of virus (T99, days) at different ambient temperatures (4 °C in blue and >15 °C in red). The horizontal lines represent the 95th centiles, and the boxes represent the 25th and 75th centiles. Median are shown as the hollow box (data sources: Table S1)
