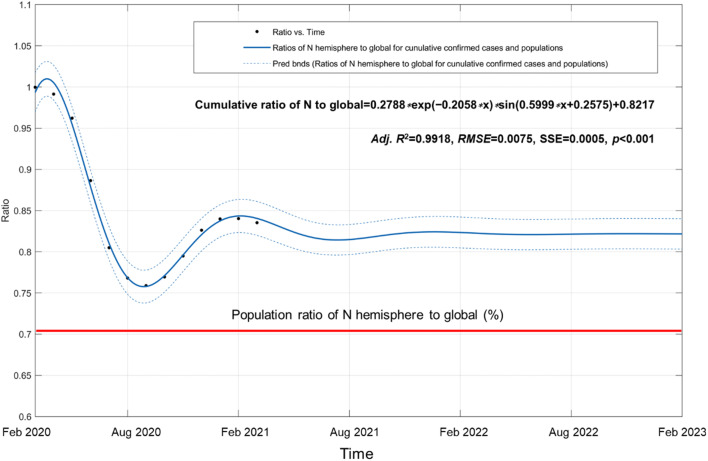
Fig. 6.
Global COVID-19 epidemic trajectory between two hemispheres during the period between Feb 2020 and Feb 2023. Dotted line shows 95% confidence intervals. Robustness of fitting model was evaluated by use of the adjusted coefficient of determination (adj R2), sum of squares due to error (SSE), root mean square deviation (RMSE), and F value using one-way analysis of variance (ANOVA) with the level of significance at α = 0.05. Means and variances were compared with Bonferroni and Tukey’s multiple tests. The red line represents the population ratio of the N hemisphere to global with 70.18%, published by the United Nations Population Division (UNPD) in 2019 (Table S4)

