Fig. 3.
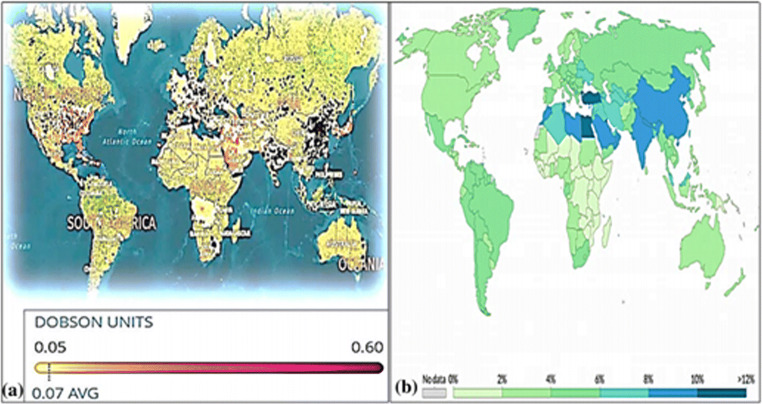
Panel a shows the world map of tropospheric NO2 concentrations from the Sentinel-5P satellite (2018). The values were measured daily for 90 days, from June to August 2018 (Chow 2020; Environmental Protection Agency, 2020, Myllyvirta and Howard 2020) (a). Panel b shows instead the world global death rate (%) by air pollution map in comparison with other diseases. Color intensity illustrating the global mortality rate due to air pollution (b). Panels a and b were reused from Fig. 3 of Paital B, Agrawal PK. Air pollution by NO2 and PM2.5 explains COVID-19 infection severity by overexpression of angiotensin-converting enzyme 2 in respiratory cells: a review. Environ Chem Lett. 2020 Sep 18:1-18. doi: 10.1007/s10311-020-01091-w obtained with License Number 4971970782195

