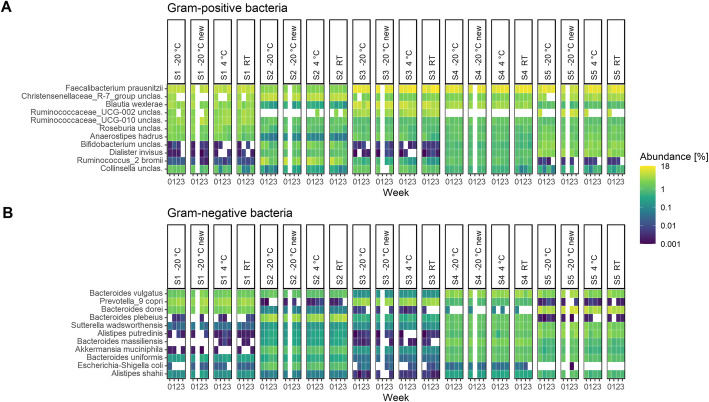
Fig. 7.
Heatmap of abundances of some selected (A) Gram-positive and (B) Gram-negative faecal bacteria under the different storage conditions: at room temperature (RT), + 4 °C, -20 °C new aliquots, repeated freezing and thawing (-20 °C), and up to three-week period for the different tested subjects (S1–S5). Numbers (0–3) below the heatmap correspond to the week of storage, where 0 is the control. The yellow colour in the heatmap indicates a high number of bacteria in the sample, while the dark blue corresponds to their low abundance. Blank place indicates the absence of data at this point

