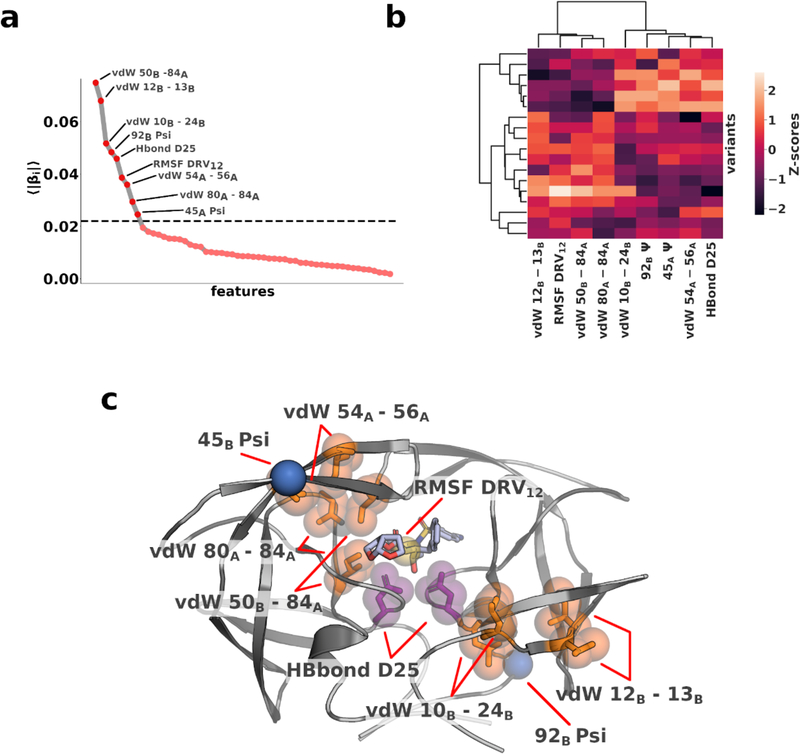
Figure 2. Molecular features indicative of inhibitor potency.
a) Absolute coefficients averaged over 100 rounds of shuffle-split cross validation. 9 features have coefficients larger than 0.02 (dashed horizontal line) b) Hierarchical clustering of the top 9 features according to coefficients c) Features with top 9 coefficients mapped onto the structure of protease–DRV complex. vdW interactions shown in orange, RMSF in yellow, torsion angle in blue and hydrogen bond in purple.

