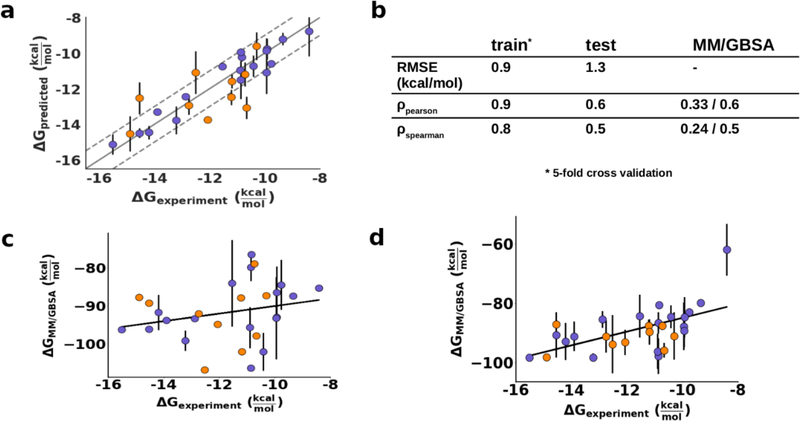
Figure 3. Evaluation of the regression model for prediction of DRV potency.
Training set shown in purple, test set shown in orange. Error bars indicate the 95% confidence interval. a) Regression model with 4 features. Training set metrics were calculated using 5-fold cross validation. b) Fit with experimental data. The correlation values for MM/GBSA correspond to the single frame and full trajectory results. c) MM/GBSA binding free energy of DRV against training and test sets averaging 3 snapshots from the trajectory. d) MM/GBSA binding free energy of DRV against training and test sets averaging the entire trajectory. Error bars correspond to the 95% confidence interval estimated from the 3 simulation replicates.

