
Figure 2.
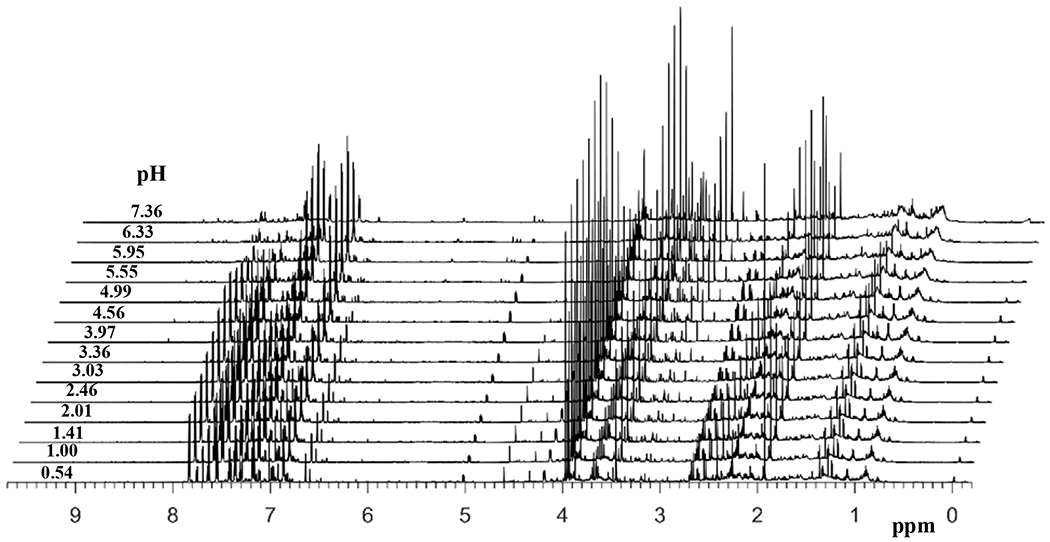
1H 1D NMR spectra, obtained at 800 MHz, of the same urine sample obtained after solvent-solvent extraction using ethyl acetate at different pH. For clarity, adjacent spectra are offset by 0.06 ppm and all spectra are plotted with reduced vertical scale.