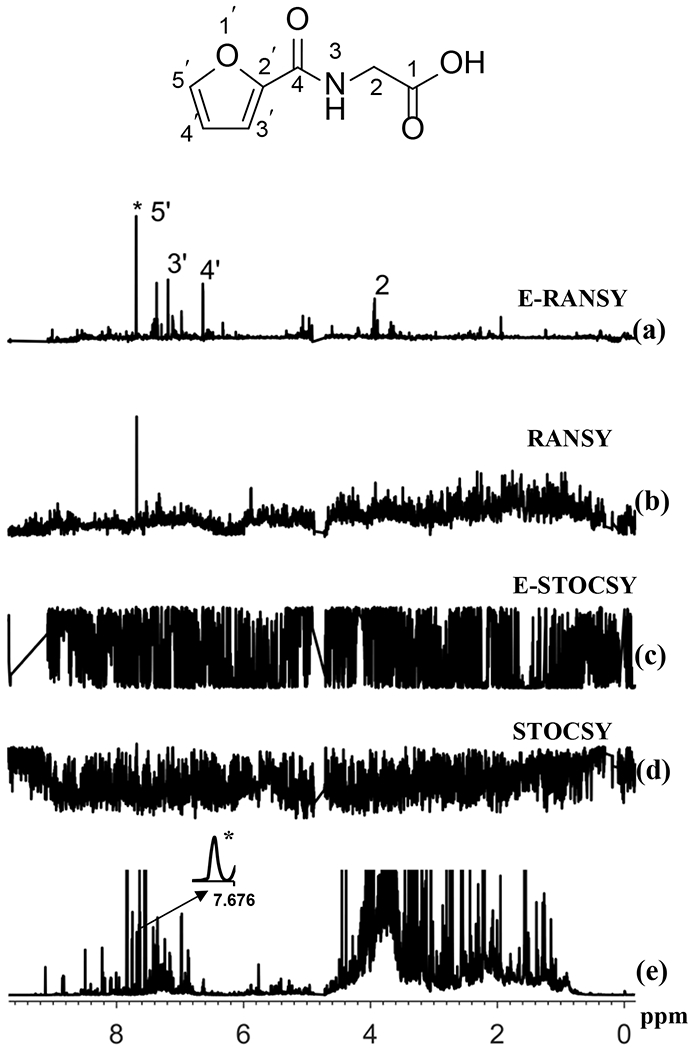
Figure 4.

Comparison of the results of ratio analysis and correlation analysis of either extracted urine or intact urine spectra using the driving peak as indicated by asterisk (*). The spectra shown are (a) E-RANSY; (b) RANSY; (c) E-STOCSY, (d) STOCSY and (e) the intact urine 1D 1H NMR spectrum. The inset shows the structure of 2-furoylglycine identified based on E-RANSY. Peaks in the E-RANSY spectrum are labeled with corresponding protons as labeled in the structure of the metabolite. For RANSY and STOCSY, intact urine NMR spectra were used; for E-RANSY and E-STOCSY, ethyl acetate extracted urine NMR spectra were used.
