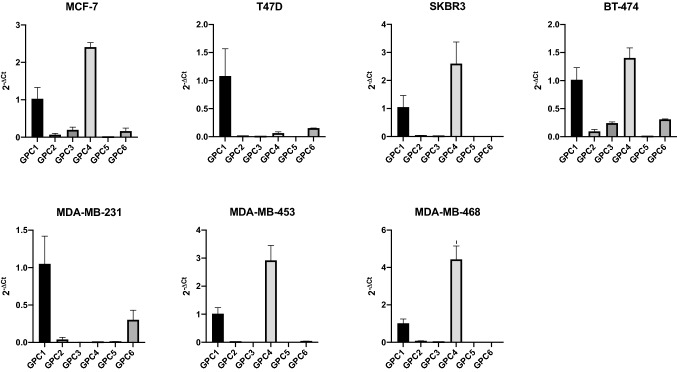
Fig. 4.
Presentation of relative mRNA expression of glypican genes within a specific cell line. Gene expression of GPC1, GPC2, GPC3, GPC4, GPC5 and GPC6 was quantified by qPCR in 7 breast cancer cell lines representative of the luminal (MCF-7 and T47D), basal (MDA-MB-231, -453 and -468) and HER2-positive (BT474 and SKBR3) breast cancer subtypes. Gene expression was normalized to the expression of β-actin and is represented by 2−ΔCt. Error bars indicate the mean and standard deviation (SD) from three individual experiments conducted in triplicates

