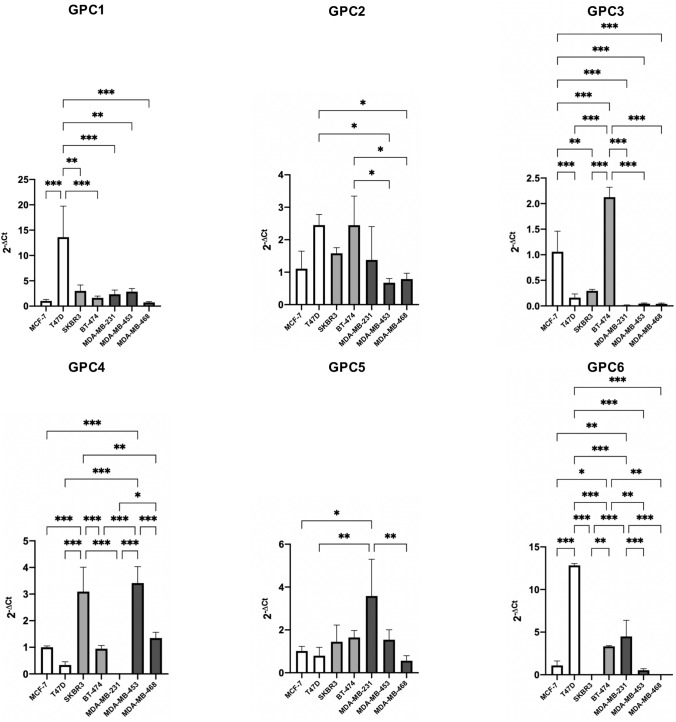
Fig. 5.
Presentation of relative mRNA expression of a specific glypican gene in seven breast cancer cell lines. Expression of the genes GPC1, GPC2, GPC3, GPC4, GPC5 and GPC6 was quantified by qPCR in 7 breast cancer cell lines representative of the luminal (MCF-7 and T47D), basal (MDA-MB-231, -453 and -468) and HER2-positive (BT474 and SKBR3) breast cancer subtypes. Gene expression was normalized to the expression of β-actin and is represented by 2−ΔCt. Error bars indicate the mean and standard deviation (SD) from three individual experiments conducted in triplicates. To test for the difference between mean gene expressions in the different breast cancer cell lines, one-way ANOVA was employed, followed by the Tukey post hoc test to correct for multiple comparisons. *P < 0.05, **P < 0.01 and ***P < 0.001

