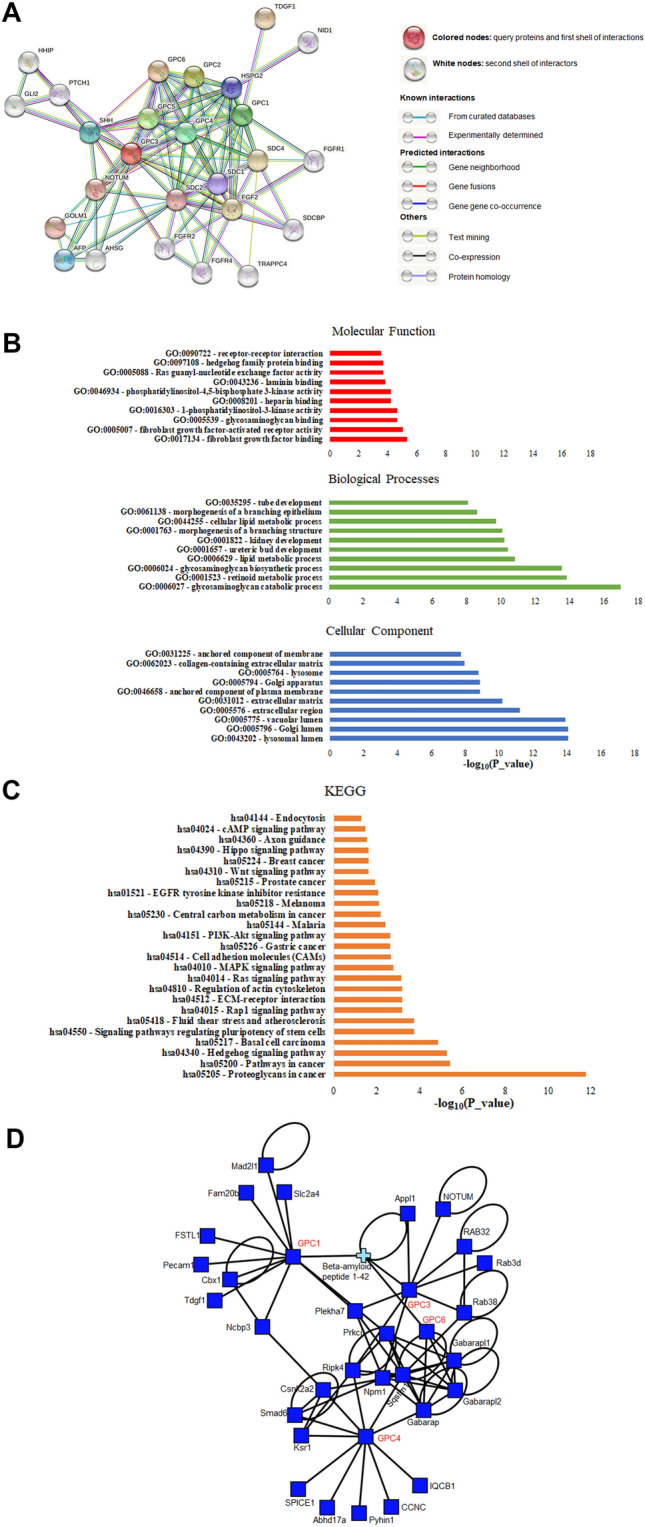
Fig. 6.

The network of glypicans and their interactors. a String database output depicting functional and physical interactors of the glypican family, GPC1, GPC2, GPC3, GPC4, GPC5 and GPC6 obtained from http://string-db.org/. The analyzed proteins are highlighted in red boxes. Highest confidence threshold of 0.900. b Gene ontology (GO) analysis of the glypicans. The 10 most significantly (FDR < 0.05) enriched GO terms in molecular function (red), cellular component (blue), and biological process (green) branches are presented. c KEGG pathway analysis. All the adjusted statistically significant values of the terms were negative 10-base log-transformed. d Protein–protein interaction network of prognostically relevant glypicans built using the iNavigator tool of the MatrixDB interaction database (Clerk et al. 2019)
