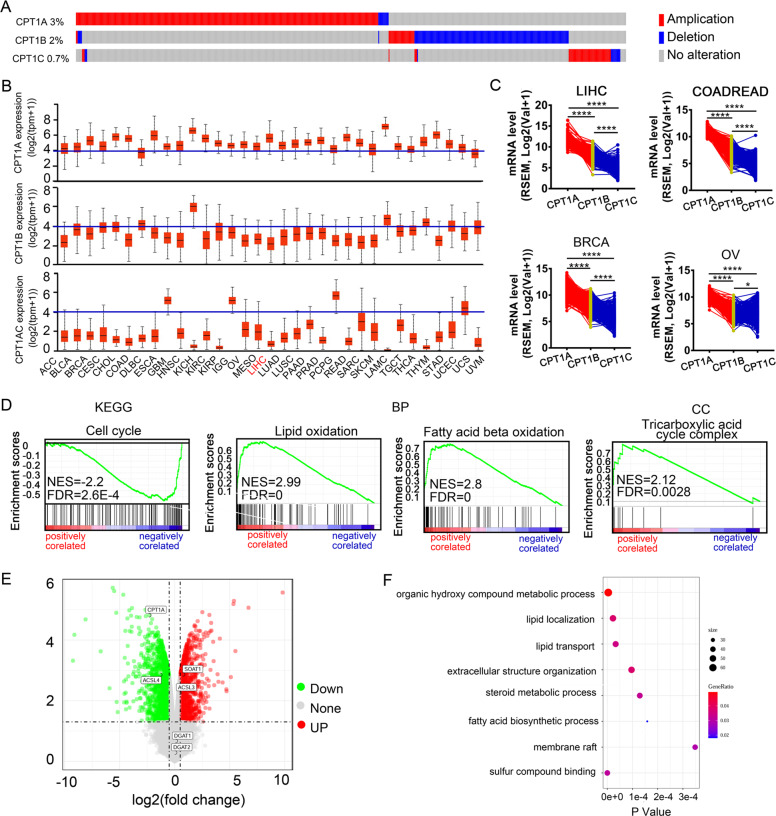
Fig. 3. CPT1A, but not CPT1B and CPT1C, plays a dominant role in human HCC and correlated inversely with SOAT1 on data mining.
A The DNA alterations of CPT1A, CPT1B, and CPT1C in 30 cancers using TCGA database from cBioPotal. B CPT1A (top), CPT1B (middle), and CPT1C (bottom) mRNA expression pattern in 30 cancer types in the TCGA database from UNICAL. C Paired profiles of CPT1A, CPT1B, and CPT1C mRNA expression in tumor tissues from individuals with HCC and other cancers in the TCGA database from linkedOmics. COADREAD colon adenocarcinoma and rectum adenocarcinoma, RSEM RNA-Seq by expectation maximization. D Enrichment analysis of the genes altered in the CPT1A neighborhood in HCC (LinkedOmics). BP biological processes, MF molecular functions, CC cellular component, KEGG KEGG pathway analysis. E CPT1A is inversely correlated with SOAT1. Volcano plot of differentially expressed. The red points represented upregulated genes. The green points represented down-regulated genes. F Gene ontology enrichment analysis of differentially expressed proteins in silencing CPT1A cell.

