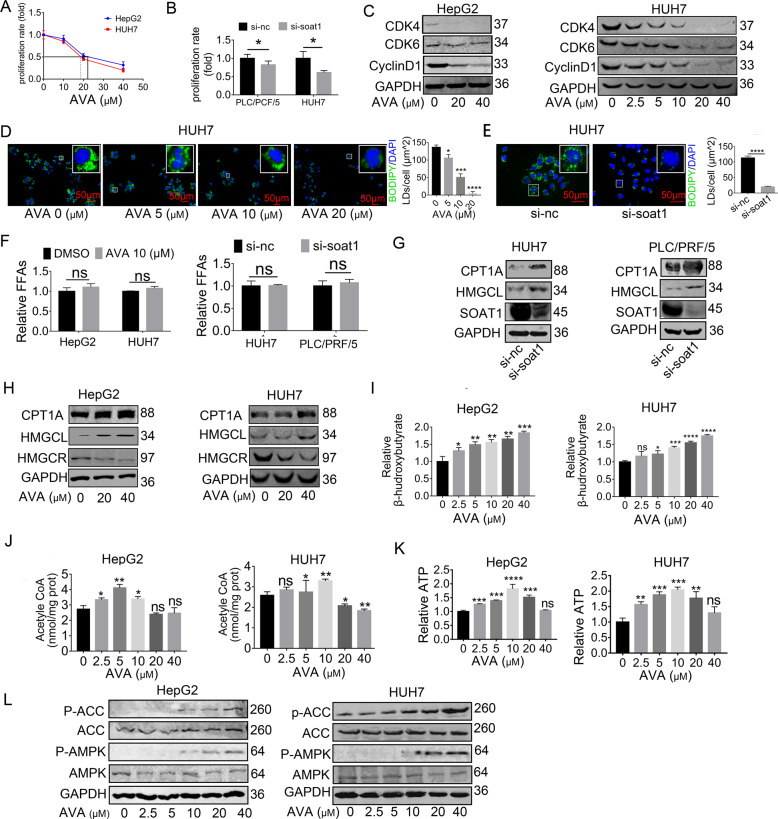
Fig. 4. SOAT1 inhibition upregulates CPT1A expression, which shuttles released FFAs into mitochondria for oxidation in vitro.
A–B CCK8 assay showed that SOAT1 knockdown inhibited cell viability in HepG2 and HUH7, (mean ± SEM, n = 3), *p < 0.05. IC50 values of avasimibe (AVA) were about 20 μm. C Western blot analysis of CDK4, CDK6, and cyclinD1 protein with AVA treatment. D–E Fluorescence imaging of LDs stained with BODIPY 493/503 (green) in HUH7 treated with pharmacological (avasimibe, 48 h) or genetic (si-RNA, 72 h) inhibition of SOAT1. Nuclei were stained with DAPI (blue). Scale bar, 50 μm. More than 30 cells were analyzed. Data were quantified using ImageJ software; *p < 0.05; ***p < 0.001, ****p < 0.0001. Significance was determined by unpaired student’s t-test. F The level of total free fatty acids in HCC cells treated with SOAT1 inhibition. (mean ± SEM, n = 3), ns, no significance. G–H Western blot analysis of CPT1A and HMGCL in HepG2 and HUH7 treated with pharmacologic or genetic SOAT1 inhibition. I–K Levels of total acetyl-CoA, ATP, and β-hydroxybutyrate in HCC cells treated with avasimibe (AVA) for 48 h at an indicated concentration (mean ± SEM, n = 3); *p < 0.05; ***p < 0.001, ****p < 0.0001; ns, no significance. L Western blot analysis of P-ACC (S79), ACC, P-AMPK (T172), and AMPK in HCC cells treated with AVA for 48 h at the indicated concentration.

