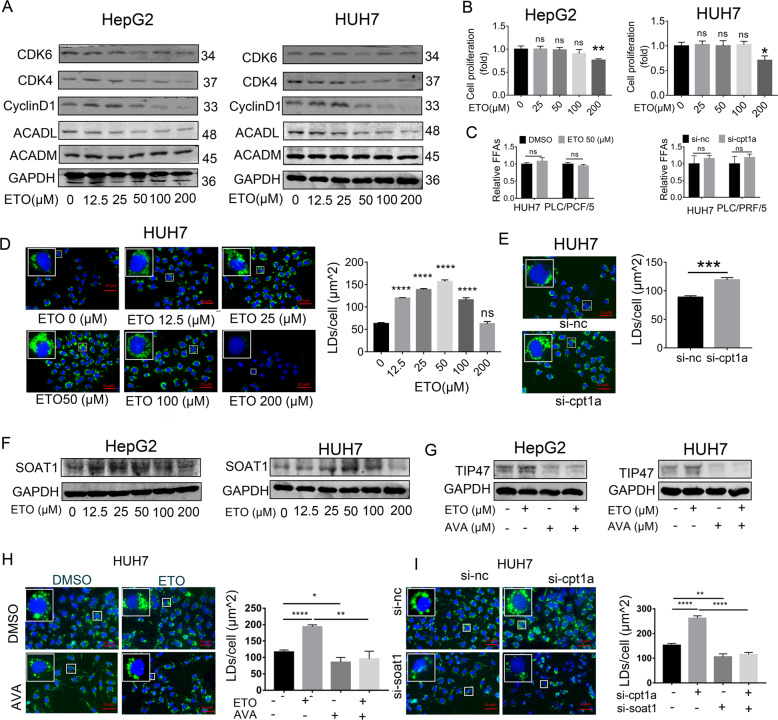
Fig. 6. Inhibiting CPT1A converts excessive FFAs into lipid drops by SOAT1.
A Western blot analysis of CDK4, CDK6, CyclinD1, ACADL, and ACADM in HCC cells treated with ETO at the indicated concentration. B CCK8 assay showed that etomoxir (ETO) inhibited cell viability in the HepG2 and HUH7 (means ± SEM, n = 3); **p < 0.01, ns, no significance. C The level of total free fatty acids in HCC cells treated with CPT1A inhibition (means ± SEM, n = 3). ns: no significance. D–E Fluorescence imaging of LDs stained with BODIPY 493/503 (green) treated with pharmacological (avasimibe, 48 h) or genetic (si-RNA, 72 h) inhibition of SOAT1 in HUH7. Nuclei were stained with DAPI (blue). Scale bar, 50 μm. More than 30 cells were analyzed. Data were quantified using ImageJ software; ***p < 0.001, ****p < 0.0001, ns: no significance. F Western blot analysis of SOAT1 in HepG2 and HUH7 treated with ETO at the indicated concentration for 48 h. G–I Cellular LDs level in HCC cells treated with ETO plus AVA. More than 30 cells were analyzed.; *p < 0.05, ***p < 0.001, ****p < 0.0001.

