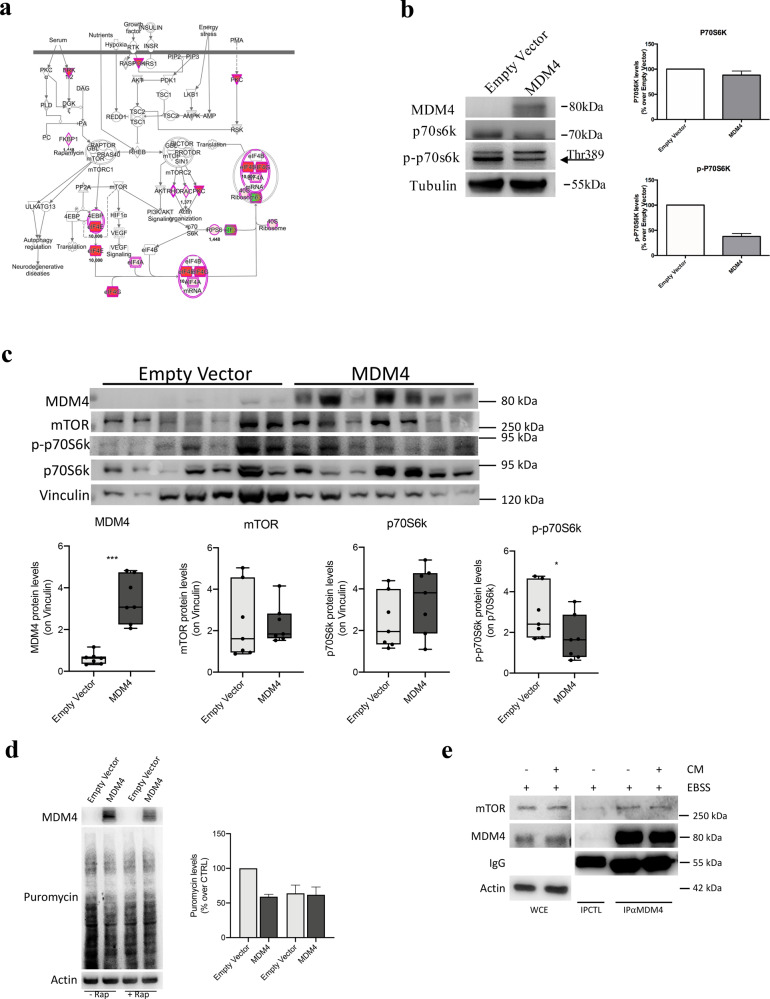
Fig. 5. MDM4 expression affects mTOR activation.
a Pathway analysis of mTOR signaling in SK-OV-3 cells. Red and green colors underlie proteins differently expressed in MDM4- compared with Empty vector-SK-OV-3 cells (red = upregulated, green = downregulated proteins). b WB of Empty Vector or MDM4-SK-OV-3 cells showing S6K1 and p70S6K1T389 expression (left panel) and quantification (right panel) (n = 3, one-sample t test p < 0.001). c WB of indicated proteins in tumor nodules (one per mouse) generated by IP injection of Empty Vector or MDM4-SK-OV-3 cells in mice; lower panels show quantification (n = 7 mice, two-sided Student’s t test, ***p < 0.001, *p = 0.048). d SunSet assay of Empty Vector- and MDM4-SK-OV-3 cells treated with rapamycin for 6 hours; quantification of two independent assays (right panel). e WB of indicated proteins in whole-cell extract (WCE) and co-immunocomplex from SK-OV-3 cells grown in EBSS for 1 hour and then in absence or presence of complete medium for additional 1 hour (CM). 1 mg of WCE was immunoprecipitated with anti-MDM4 antibody (IPαMDM4) or control Ig (IPCTL). Right panel shows the analysis of 1/100 of WCE.

