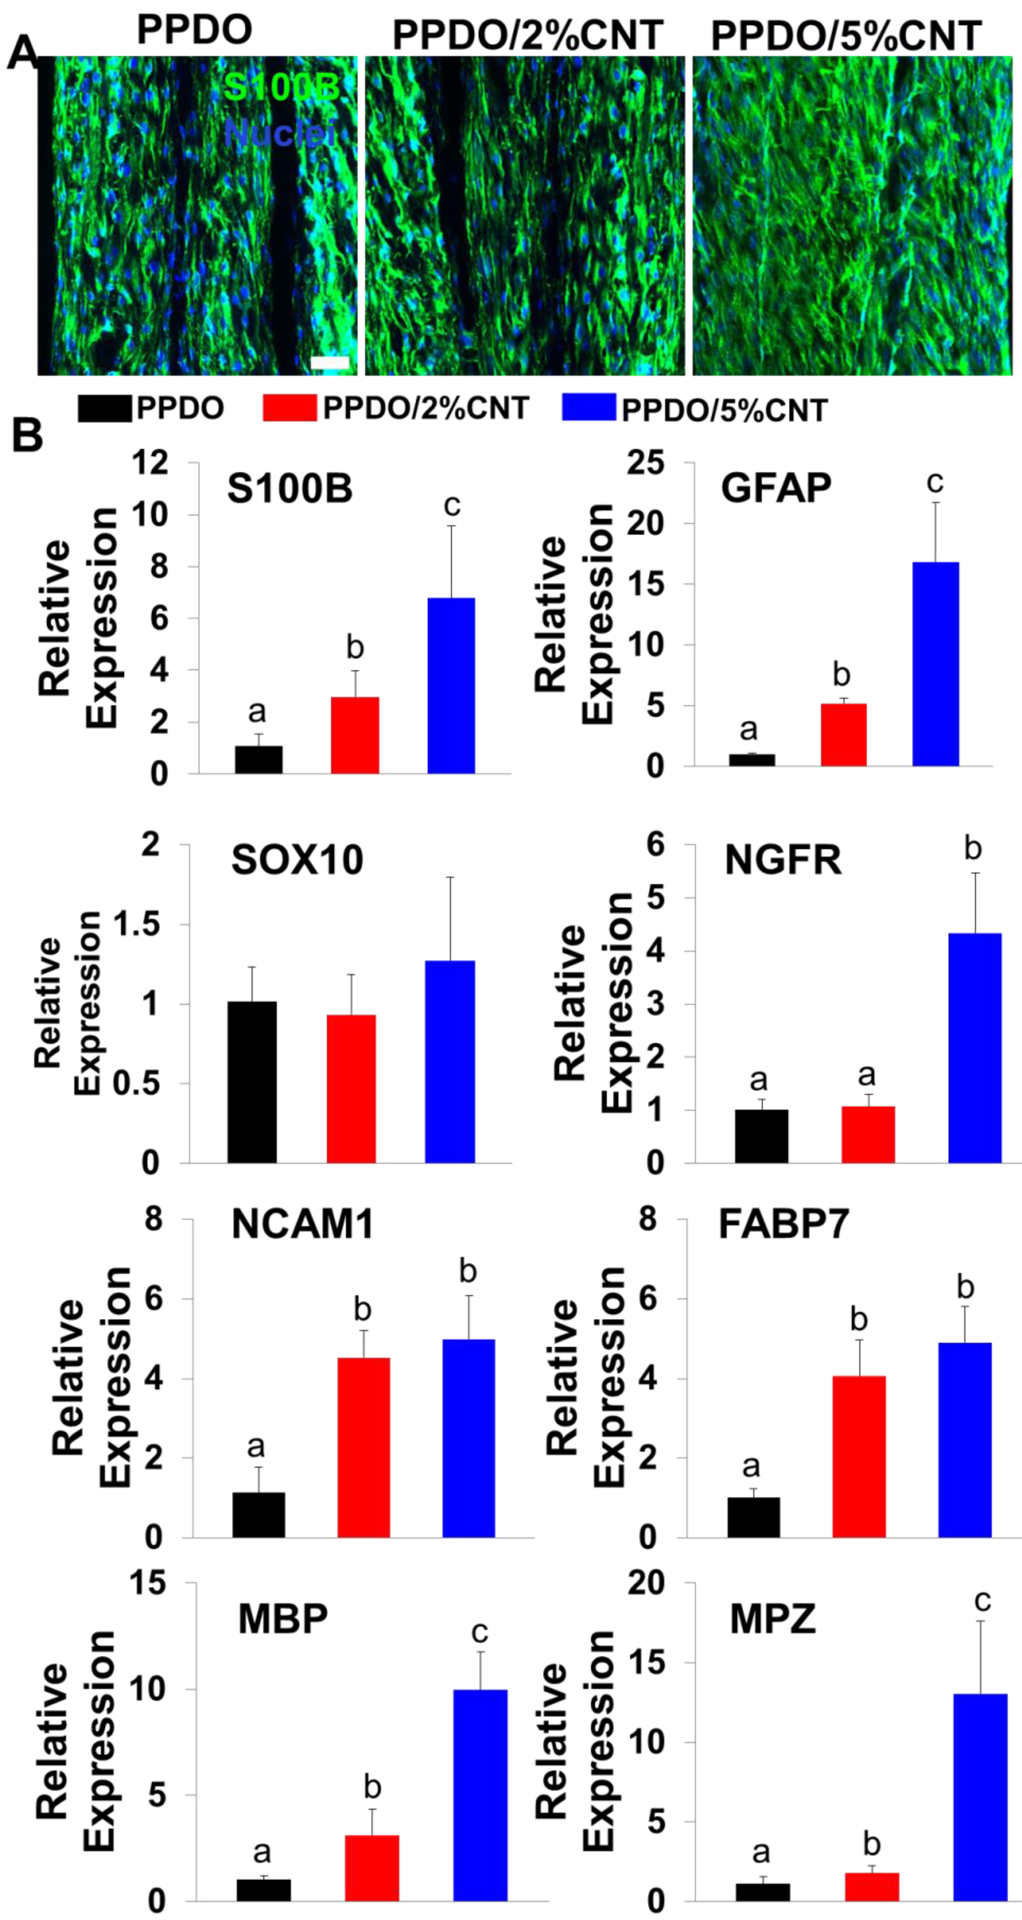
Figure 5.

(A) IF staining for S100B (green), and nuclei (blue) of rSCs on PPDO NYs, PPDO/2%CNT NYs and PPDO/5%CNT NYs after 14 days of culture; Scale bar=50 μm. (B) QRT-PCR analysis of S100B, GFAP, SOX10, NGFR, NCAM1, FABP7, MBP, and MPZ mRNA expression of rSCs seeded on three different NY materials after 14 days of culture. Relative expression is presented as normalized to 18S mRNA and relative to rSCs seeded on PPDO NY bundles (n=3; bars with different letters represent a significant difference between two groups, p<0.05).
