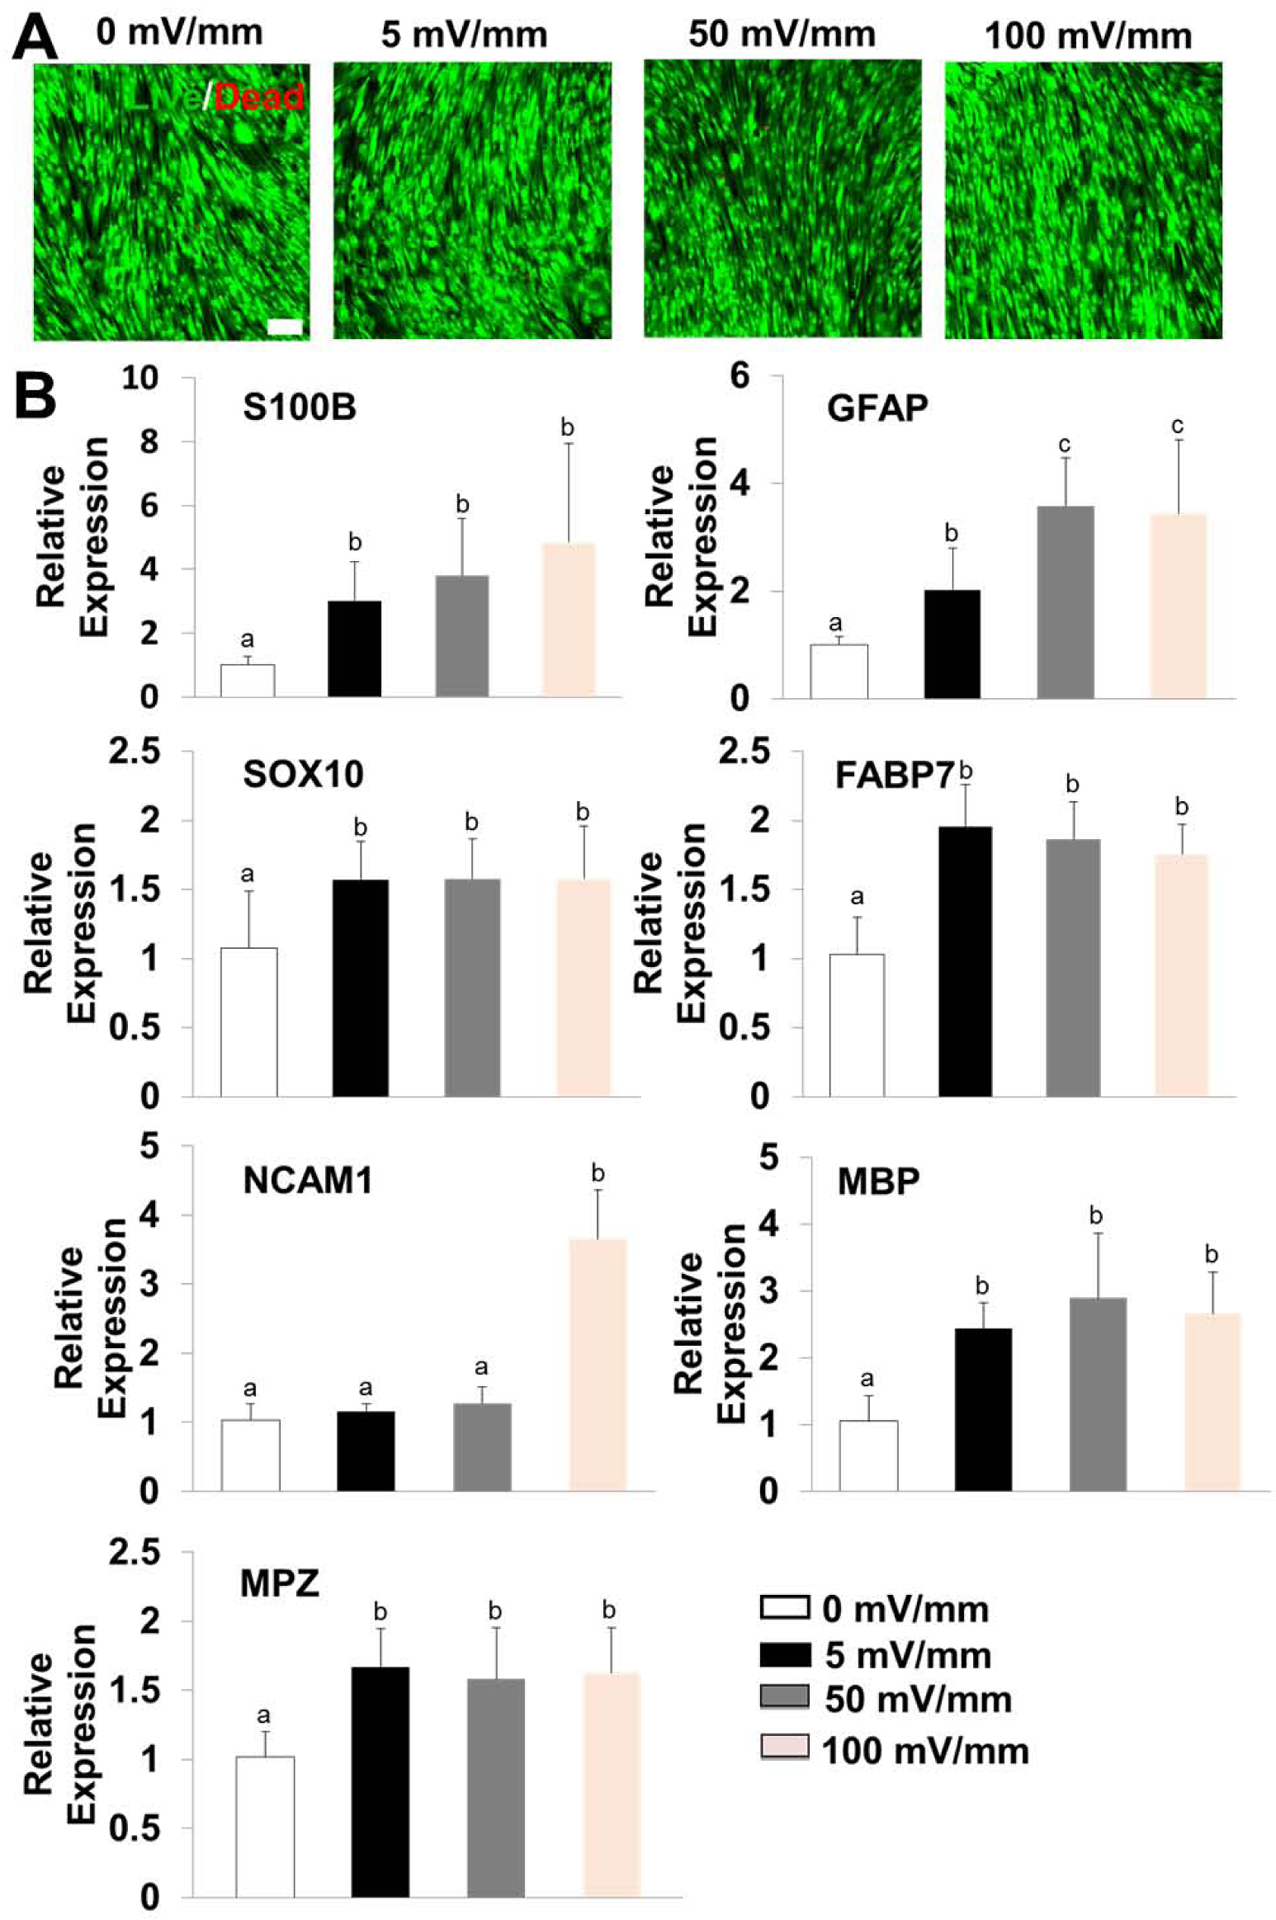
Figure 6.

(A) Representative images of Live/Dead staining of rSCs seeded on 2D substrates under ES treatment with different potentials ranging from 0–100 mV/mm throughout 7 days of culture; Scale bar=100μm. (B) QRT-PCR analysis of S100B, GFAP, SOX10, NCAM1, FABP7, MBP, and MPZ mRNA expression of rSCs seeded on glass substrates under ES treatment with different potentials ranging from 0–100 mV/mm throughout 7 days of culture. Relative expression is presented as normalized to 18S mRNA and relative to rSCs seeded on glass substrates and unstimulated (n=3; bars with different letters represent a significant difference between two groups, p<0.05).
