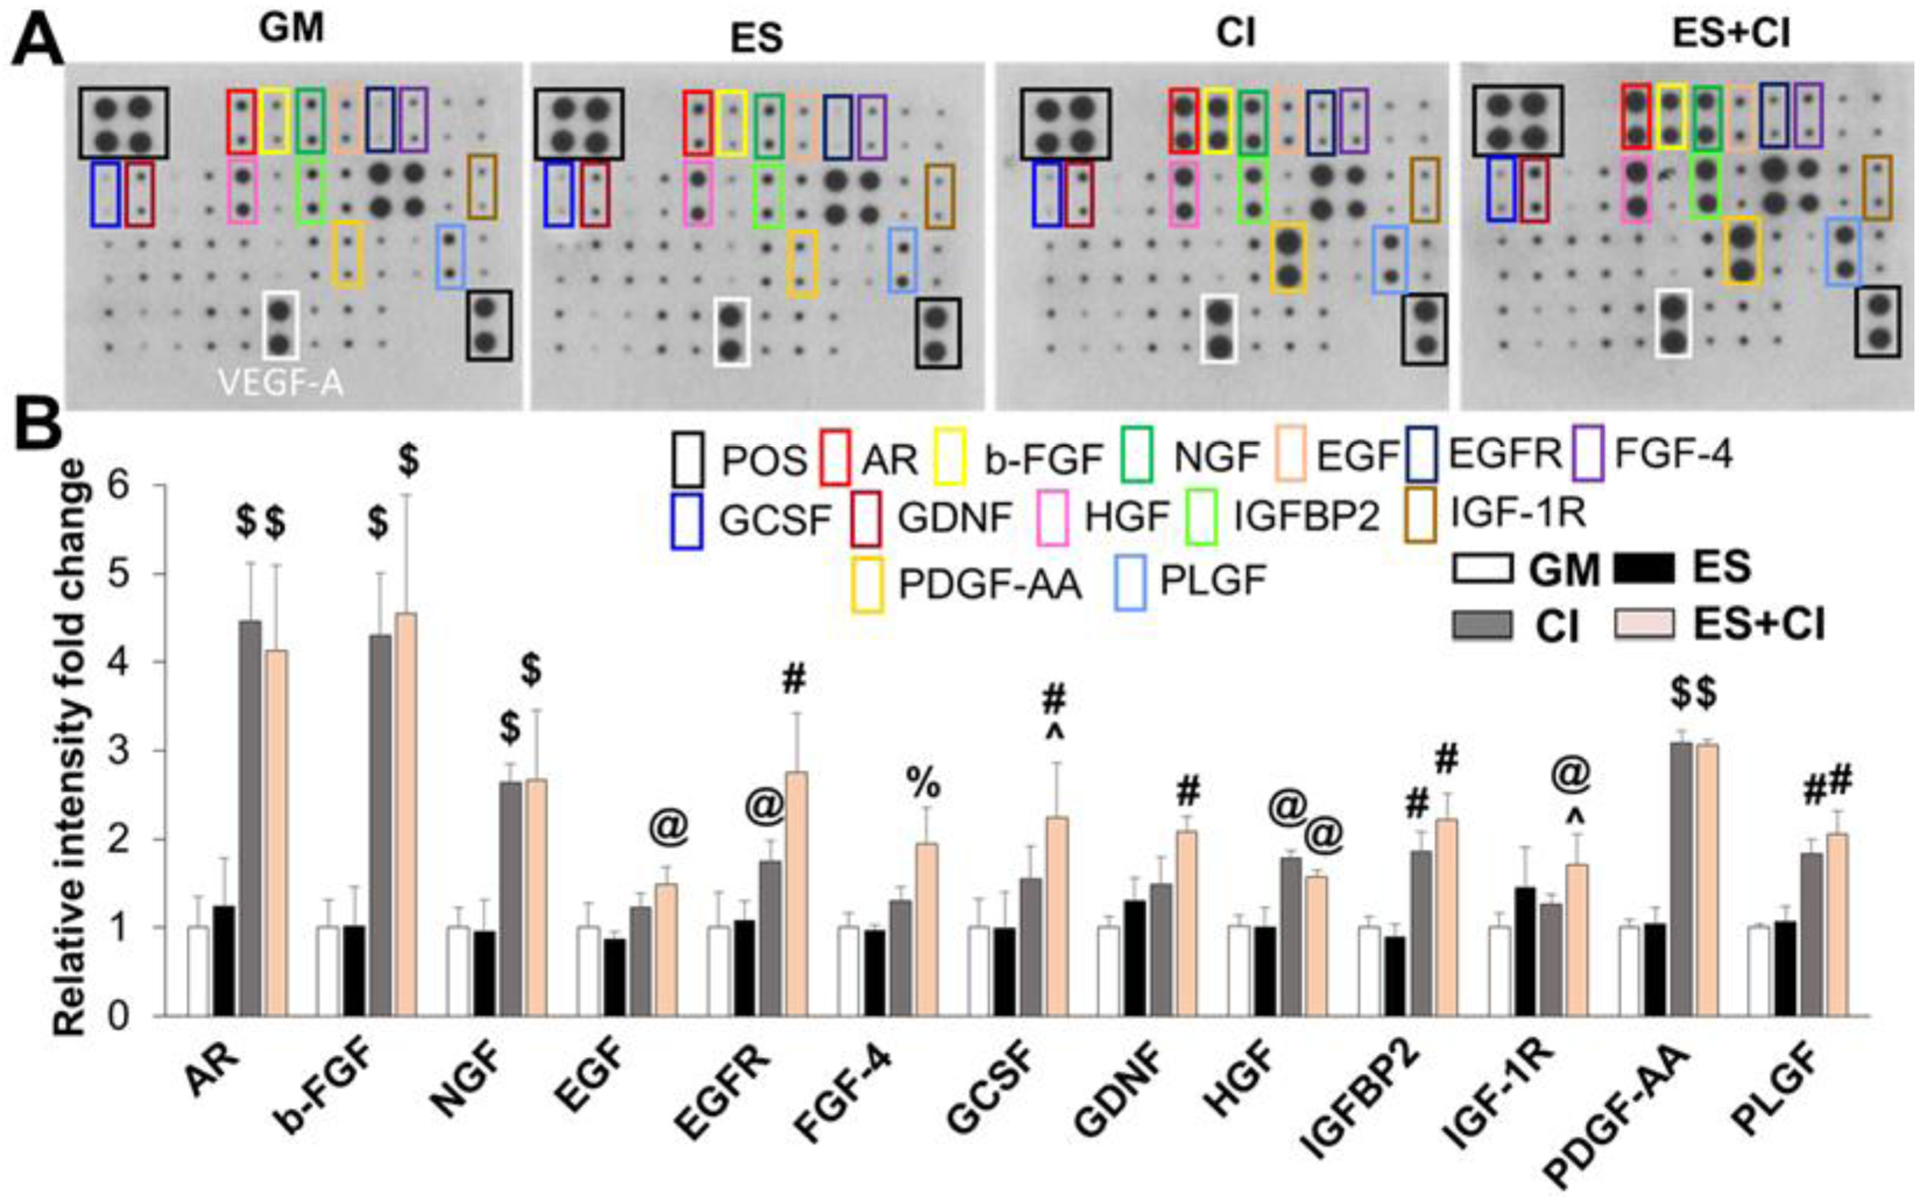
Figure 8.

Secretion of growth factors from hADMSC-SCLCs in GM, ES, CI, and ES+CI groups. (A) Representative images of human growth factor array assay. (B) Semi-quantitative analysis of the secreted growth factors with statistical difference. Relative expression of each targeted growth factor was presented as normalized to the positive control on the same array and relative to hADMSC-SCLCs in GM group (n=4; @ p<0.05 compared to GM and ES groups, #p<0.01 compared to GM and ES groups, $ p<0.001 compared to GM and ES groups, % p<0.05 compared to GM, ES, and CI groups, ^ p<0.05 compared to CI group).
