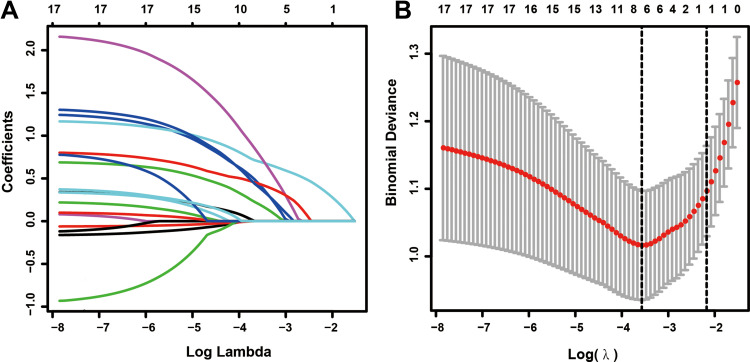
Figure 2.
Feature selection using the LASSO regression analysis. (A) LASSO coefficient profiles of the non-zero variables of AKI patients. A coefficient profile plot was produced against the log (lambda) sequence. (B) Seven features with nonzero coefficients were selected by optimal lambda. By verifying the optimal parameter (lambda) in the LASSO model, the partial likelihood deviance (binomial deviance) curve was plotted versus log (lambda).

